

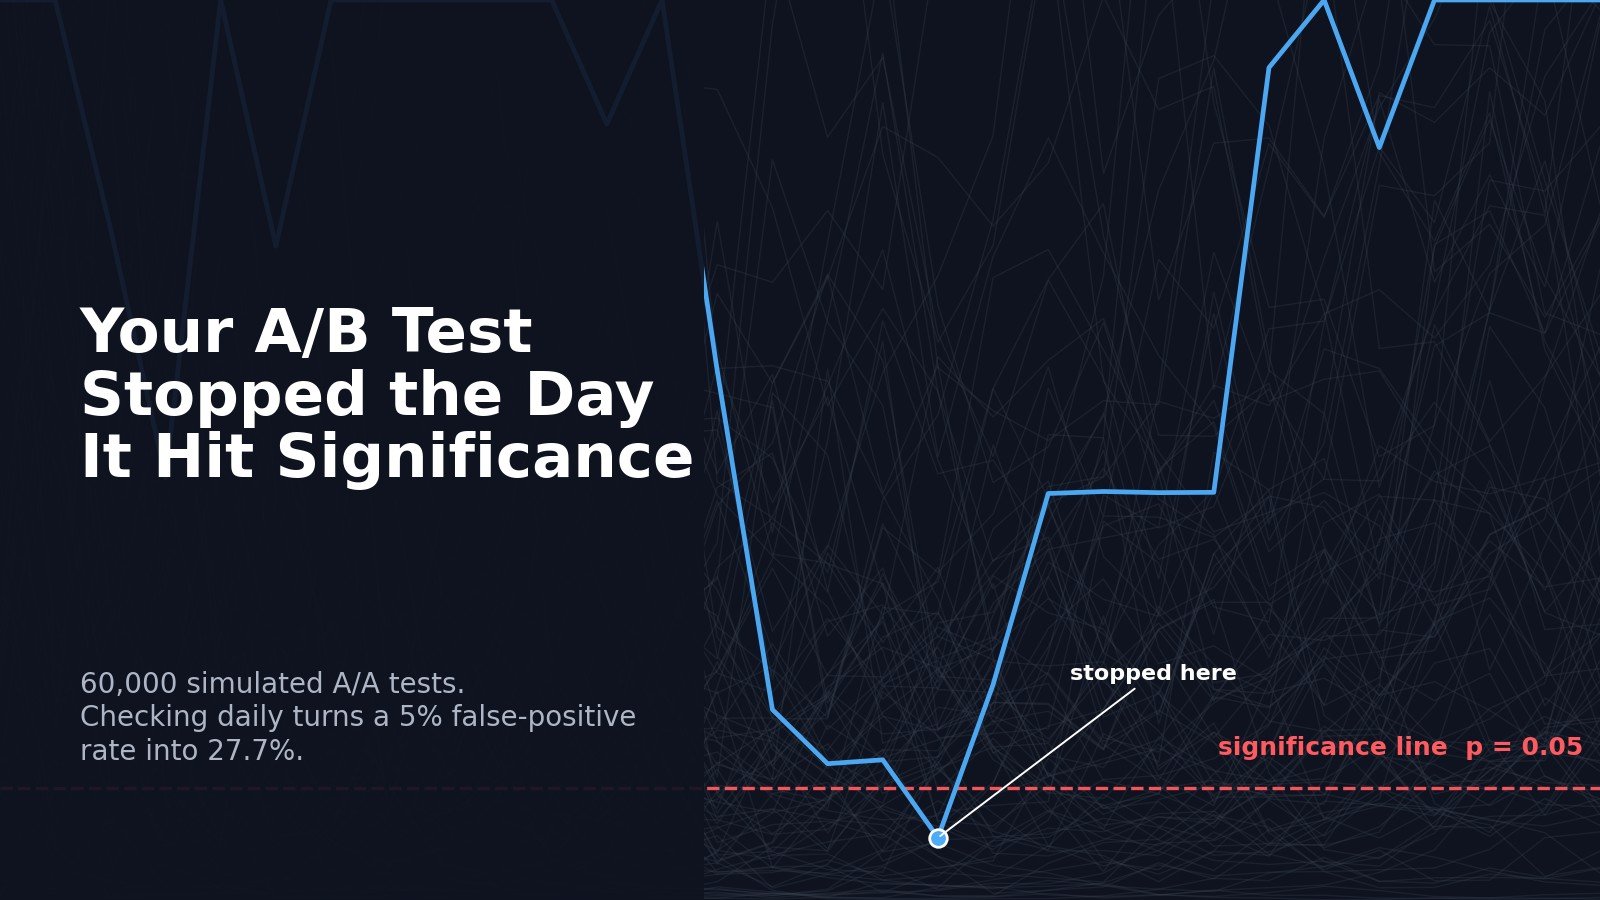
in a fairly straightforward way. They launch a test, open the dashboard every morning, and wait for the p-value to drop below 0.05. When it does, the result looks official enough to ship. The line has been crossed, the number looks clean, and the winner seems ready to call.
I would not say that this routine is always done carelessly. In most cases, the team is doing exactly what the standard tutorial taught them to do: define the hypothesis, pick the metric, run the two-proportion z test or t test, and reject the null when p falls below 0.05. Some guides even add the valuable step of calculating the required sample size before the test starts.
But there is one crucial thing that often gets missed. The 5 percent false-positive rate is written for one look at one fixed sample, and the math changes once the same dashboard is checked again and again before the experiment ends.
I ran a simulation to make this visible. The setup was deliberately ordinary: two versions, A and B, both converting at the same true 10 percent rate; 1,000 visitors per arm per day; a two-sided test at the 5 percent level; and 30 days of traffic. Nothing was different between A and B. There was no product improvement to find. The only thing the test could discover was noise.
import numpy as np
from scipy import stats

RNG = np.random.default_rng(5)
n_sims = 60_000
n_days = 30
visitors_per_arm_day = 1_000
p_true = 0.10

def two_prop_z(succ_a, n_a, succ_b, n_b):
    pa, pb = succ_a / n_a, succ_b / n_b
    pool = (succ_a + succ_b) / (n_a + n_b)
    se = np.sqrt(pool * (1 - pool) * (1 / n_a + 1 / n_b))
    z = (pb - pa) / se
    return z, 2 * stats.norm.sf(np.abs(z))

inc_a = RNG.binomial(visitors_per_arm_day, p_true, size=(n_sims, n_days))
inc_b = RNG.binomial(visitors_per_arm_day, p_true, size=(n_sims, n_days))
cum_a, cum_b = inc_a.cumsum(axis=1), inc_b.cumsum(axis=1)
n = np.cumsum(np.full((n_sims, n_days), visitors_per_arm_day), axis=1)
_, p_daily = two_prop_z(cum_a, n, cum_b, n)
false_positive_daily = (p_daily < 0.05).any(axis=1).mean()
If the test was checked only once at the end, the false-positive rate landed where it should: about 5 percent. But if the test was checked every day and stopped as soon as p dropped below 0.05, the false-positive rate went to 27.7 percent. In other words, more than one in four “wins” were wins created by the stopping rule, not by the product.
What this piece adds is a direct measurement of the inflation and a side-by-side benchmark of the fixes on the same simulated data. I use a seeded simulation to measure the false-positive rate under daily peeking, then compare the fixed-sample design, a group-sequential Pocock boundary, and an always-valid p-value by how much validity and speed each one keeps.
The tutorial version is not enough
The usual public explanation of A/B testing gives the impression that the test statistic is the whole story. You compute the p-value, compare it with 0.05, and make the call. By itself, that routine is fine, but it is incomplete for the way product teams actually run experiments.
In practice, people rarely wait quietly until the pre-planned end of the test. They look at the dashboard more than once. If the result looks good on day four, or day eight, or day twelve, the pressure to stop becomes very real. The dashboard says significant, the roadmap is waiting, and the business wants the answer.
The problem is that every new look gives the same random process another chance to wander across the line. A p-value is not a stable property of the experiment while the data is still accumulating. It moves with the next batch of users, which means a dip that looks decisive on one day can disappear completely the next.
This is why the phrase “we stopped when it became significant” is not a harmless operational detail. It is part of the statistical design. If the stopping rule is not valid, the p-value at the stopping day does not mean what the team thinks it means.
How bad it gets depends on how often you look
The damage grows with the number of looks. In the simulation:
| How often you look | False-positive rate |
|---|---|
| 1 look, end only | 5.0% |
| 2 looks | 8.3% |
| 5 looks | 14.0% |
| 10 looks | 19.1% |
| Daily, 30 looks | 27.7% |
The intuition is simple. If you give noise many chances to look like a signal, some of those looks will cross the threshold by chance. And the team that stops at first significance never sees the later correction. It records the lucky day as the result.
Among the identical-arm tests that crossed the 0.05 line at least once, half had crossed by day five. That is exactly the moment when a team is most tempted to declare a fast win. But it is also exactly when the sample is still small and the estimate is most fragile.

Even a real winner gets exaggerated
The same issue shows up even when the effect is real. I reran the simulation with B genuinely better than A: A converted at 10 percent and B at 11 percent, a true relative lift of 10 percent. A test that ran to the fixed 30-day horizon recorded a median lift of 10.1 percent, basically centered on the truth.
But a test stopped at first significance recorded a median lift of 12.7 percent. The winner was real, but the measured size of the win was inflated by about a quarter. This happens because crossing the line early usually requires an unusually favorable swing.
This matters in a very practical way. The lift is not just a statistical number. It becomes the number used in the revenue forecast, the launch case, and the roadmap discussion, and sometimes it is the reason another project gets deprioritized. If the experiment oversold the lift before the feature ever shipped, the rollout can disappoint even when the product change actually helped.

So when an early stop is unavoidable, the measured lift at the stopping moment should not be treated as the clean forecast. The more honest number is either the estimate from a method that accounts for the repeated looks, or the estimate at a pre-committed horizon. The gap between those numbers is worth showing to anyone who is planning against the result.
You can look early, but the method has to allow it
This does not mean teams have to choose between watching the experiment and trusting the result. It means the stopping rule needs to match the way the test is actually being monitored.
The first option is the simplest: fix the sample size in advance and treat the dashboard as off-limits for inference until the endpoint. In the simulation, this held the false-positive rate at 5.1 percent. The limitation is obvious. You have to wait for the full sample even when the effect becomes large and visible early.
The second option is group-sequential testing. This is the family of methods clinical trials have used for decades. You decide in advance how many times you will look, and you raise the threshold at each look so that all those looks together spend only the error rate you intended. In the simplest Pocock-boundary version, the same stricter cutoff is used at every look. Calibrated here, it used a z cutoff of 2.73 rather than the usual 1.96, and held the false-positive rate at 4.9 percent under daily monitoring.
The third option is always-valid inference, which is built for the online-experiment reality of checking whenever the dashboard updates. Instead of a fixed-sample p-value, it uses a quantity that remains valid no matter when or how often you look. In this simulation, the always-valid p-value held the false-positive rate at 1.5 percent, which is conservative because it protects against stopping at any time, not just across one fixed month.
# Pocock-style daily boundary, calibrated on the null
z_daily, _ = two_prop_z(cum_a, n, cum_b, n)

def false_positive_at_boundary(z_values, boundary):
    return (np.abs(z_values) > boundary).any(axis=1).mean()

# In the seeded run used here, the calibrated constant boundary is 2.73,
# compared with the usual fixed-sample 1.96.
pocock_boundary = 2.73
fp_pocock = false_positive_at_boundary(z_daily, pocock_boundary)

# Always-valid p-value from a mixture sequential probability ratio test
TAU = 0.01  # prior SD on the true absolute difference, about 1pp on a 10% base

def msprt_pvalue(diff, var):
    tau2 = TAU ** 2
    lam = np.sqrt(var / (var + tau2)) * np.exp(
        diff**2 * tau2 / (2 * var * (var + tau2))
    )
return np.minimum(1.0, 1.0 / lam)| Method | False-positive rate under the null | Power vs true 10% lift | Typical days to decide |
|---|---|---|---|
| Fixed sample, no peeking | 5.1% | 97.9% | 30 |
| Daily peeking, naive 0.05 | 27.7% | not meaningful | about 5 |
| Daily peeking, Pocock boundary | 4.9% | 93.3% | 11 |
| Daily peeking, always-valid p-value | 1.5% | 87.5% | 14 |
This is the part that is often missed in product discussions. The corrected methods make the result more honest while keeping much of the speed that made peeking attractive in the first place.
Speed only becomes a problem when it sits outside the design.
Against a true 10 percent lift, the fixed-sample design caught the effect 97.9 percent of the time, but only at day 30 by design. The Pocock boundary caught it 93.3 percent of the time with a typical decision by day 11. The always-valid p-value caught it 87.5 percent of the time with a typical decision by day 14.
That is the useful tradeoff. You can stop early when the effect is real, but you are no longer pretending that the first naive p < 0.05 means the same thing as a single fixed-sample test. The speed becomes part of the design instead of an informal habit layered on top of it.
The always-valid method is more conservative in this setup, because it is paying for a guarantee that holds at any stopping time. The prior used in the simulation can also be tuned. If a team sets it closer to the effect size it genuinely expects, it can recover power. The choice of method depends on how the team wants to run the experiment, but the method has to know the team is looking.
A few limits worth saying out loud
This simulation measures one slice of the problem: one metric, one treatment against one control, clean randomization, and steady daily traffic. Real experimentation programs are usually messier. Teams test multiple metrics, several variants, and sometimes several segments at the same time. Each of those choices adds another layer of multiplicity, so the numbers here are closer to a floor than a worst case.
The simulation also does not solve novelty effects or weekday patterns. If users react differently in the first few days because something is new, or if the business has strong day-of-week cycles, a minimum runtime of one or two full weeks may still be necessary regardless of the sequential method. Variance-reduction methods such as CUPED are also complementary. They reduce the sample size needed, but they do not by themselves fix the stopping-rule problem.
So the practical lesson is not to stop looking at the dashboard. Teams will look at the dashboard, and that is fine. The act of looking just has to be part of the design, not something that happens outside the statistics.
What the next A/B testing guide should teach
A better A/B testing guide would make four changes.
First, state the stopping rule before the test starts, the same way you state the metric and the hypothesis. The stopping rule determines whether the p-value will mean anything when you use it.
Second, if you will look once, do the power calculation and commit to the sample size. This is the highest-value basic habit and it is already available to anyone who can compute an effect size.
Third, if you will look repeatedly, use a method built for repeated looks. A group-sequential boundary works when the number of looks is fixed in advance. An always-valid p-value works when the team wants the freedom to check whenever it wants.
Fourth, report the stopping rule next to the result. A reader should be able to see whether the 5 percent claim is real, or whether it only looks real because the test stopped on the lucky day.
The z test is sound when it is used in the setting it was built for. The error comes from using a guarantee written for one fixed look to justify repeated looks. Choose a stopping rule that matches how the team actually behaves, and the p-value can keep the meaning it was supposed to have.
References
- Armitage, P., McPherson, C. K., and Rowe, B. C. Repeated Significance Tests on Accumulating Data. Journal of the Royal Statistical Society Series A, 1969.
- Wald, A. Sequential Analysis. Wiley, 1947.
- Pocock, S. J. Group Sequential Methods in the Design and Analysis of Clinical Trials. Biometrika, 1977.
- O’Brien, P. C., and Fleming, T. R. A Multiple Testing Procedure for Clinical Trials. Biometrics, 1979.
- Lan, K. K. G., and DeMets, D. L. Discrete Sequential Boundaries for Clinical Trials. Biometrika, 1983.
- Johari, R., Koomen, P., Pekelis, L., and Walsh, D. Always Valid Inference: Continuous Monitoring of A/B Tests. Operations Research, 2022.
- Howard, S. R., Ramdas, A., McAuliffe, J., and Sekhon, J. Time-uniform, Nonparametric, Nonasymptotic Confidence Sequences. Annals of Statistics, 2021.
- Deng, A., Lu, J., and Chen, S. Continuous Monitoring of A/B Tests without Pain: Optional Stopping in Bayesian Testing. IEEE DSAA, 2016.
- Kohavi, R., Tang, D., and Xu, Y. Trustworthy Online Controlled Experiments. Cambridge University Press, 2020.
- Simmons, J. P., Nelson, L. D., and Simonsohn, U. False-Positive Psychology. Psychological Science, 2011.
Reproducibility note: the figures and rates in this article come from a seeded Python simulation using numpy, scipy, and matplotlib. No external dataset is used. Each experiment is simulated from known ground truth, which is the only way to measure a false-positive rate directly. The key simulation and method-calibration code is included above; the reported rates are Monte Carlo estimates from the seeded run and can vary by a few tenths of a percentage point across seeds.