

The problem with point estimates
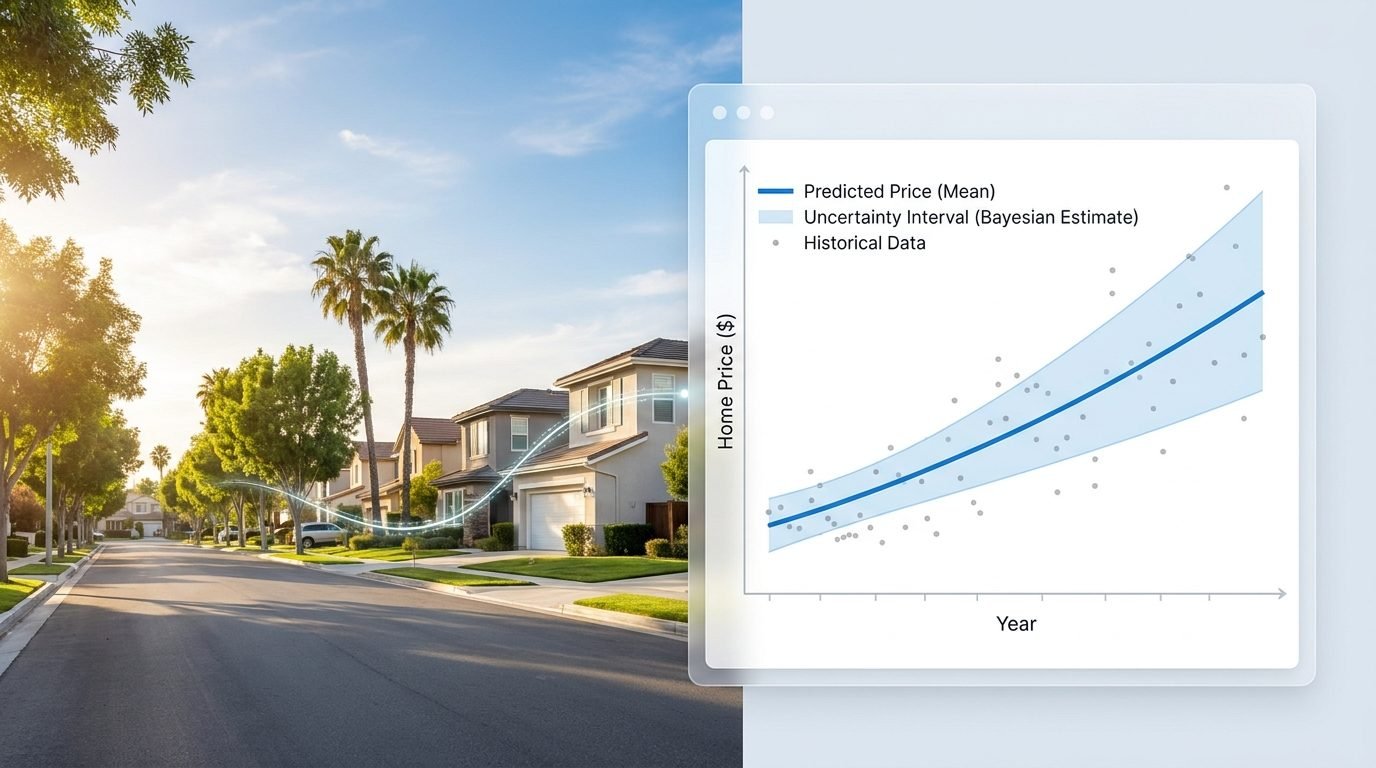
When a machine learning model estimates the median value of a house in California, it usually hands you a single number: $385,000.
That number may look precise. But hiding behind that estimate is uncertainty, and that uncertainty can arise from a variety of factors. Is the prediction uncertain because the neighborhood features are inherently noisy, or because the model has simply never seen a location quite like this one?
Standard neural networks outputting single numbers cannot answer these questions. They will report error metrics, such as mean absolute error (MAE). Yet, this is just an average across a test dataset. MAE tells me nothing about the specific house I’m looking at right now. Adopting a Bayesian framework allows us to move from asking “What is the predicted home value?” to “What is the range of plausible values, and how sure are we?”
Several recent Towards Data Science articles, such as Bayesian Guardrails for AI Decisions, have made excellent cases for considering uncertainty in automated decision-making. In this article, we’ll walk through a practical implementation and the engineering decisions it entails. Specifically, we’ll be constructing a Bayesian Neural Network using Python and the California Housing dataset. You will learn how to parameterize weight distributions, run variational inference, and extract actionable uncertainty bounds that reveal exactly when your model should and shouldn’t be trusted.
Ideally, we’d like to plug some numbers into Bayes’ theorem and compute the exact solution for our neural network. Unfortunately, this exact calculation is computationally intractable. A neural network with even a few thousand parameters creates a math problem that can be solved in theory but takes way too much time or memory to be useful in practice. As a result, implementing a Bayesian Neural Network leaves us with several design choices and training strategies. This article is focused on understanding those choices and how to implement them. Our shared Python notebooks are not optimized for network layer size or other hyperparameters. Rather, they are intended to highlight the engineering challenges involved in Bayesian Neural Network implementation. For illustrative purposes, each notebook highlights one specific design choice. A production system should include combinations of these choices.
Uncertainty Quantification
Before getting into the data and code, we need to further explore uncertainty quantification, as not all uncertainty is created equal. Philosophically, there are two broad types of uncertainty that have been discussed since the 17th century. Epistemic uncertainty is generally presented in terms of model uncertainty. We may be asking for a prediction on a home with features our model has never seen before. Conversely, aleatoric uncertainty is commonly presented as uncertainty from natural variability. Our model has seen plenty of houses like this one. Yet, the value of those similar homes is volatile, and our model is uncertain what to predict.
Distinguishing between these two types of uncertainty is useful in practice, and there are mathematical formalisms that claim to separate aleatoric from epistemic uncertainty. Yet, the research literature has ended up with multiple mathematical definitions for the same philosophical concepts, and in some cases, conflicting definitions for the same concept. Current research is pointing us toward the unfortunate realization that aleatoric and epistemic uncertainty are mathematically intertwined in much of machine learning.
The blog post Reexamining the Aleatoric and Epistemic Uncertainty Dichotomy has an excellent deep dive into this issue. For this article, we’ll restrict ourselves to a single uncertainty estimator without the specific labeling of aleatoric and epistemic.
Dataset Overview: California Housing
The California Housing Dataset in scikit-learn (BSD license) originated from the work of Pace and Barry (1997). It’s worth noting that the data was derived from the 1990 U.S. census and the house prices we’ll discuss do not reflect today’s market. If only we could still purchase beachfront property for the prices in this dataset!
Each row in the dataset contains a summary of a census block group, which is the smallest geographical unit for which the U.S. Census Bureau samples data and consists of geographic areas of a few hundred to a few thousand people. The dataset contains the following eight features from 20,640 California homes.
|
Feature |
Description |
|
MedInc |
median income in block group |
|
HouseAge |
median house age in block group |
|
AveRooms |
average number of rooms per household |
|
AveBedrms |
average number of bedrooms per household |
|
Population |
block group population |
|
AveOccup |
average number of household members |
|
Latitude |
block group latitude |
|
Longitude |
block group longitude |
Our target variable is the median house value for each California census block. The dataset arbitrarily sets all prices above $500,000 to $500,000 so we removed all homes at $500,000 to help the network learn. This notebook contains our pre-processing and creation of training and testing data.
Comparison of traditional neural networks and Bayesian neural networks
A standard neural network is essentially a massive machine with millions of tiny knobs called weights. Each weight controls how much one piece of information influences the final answer. In supervised learning, a network is given inputs and known outputs; the neural network makes predictions and looks at how far off each prediction is. It goes back through all those millions of knobs and slightly adjusts them so that, next time, the answer is a little closer to the correct answer. A standard network gives us a single, firm answer. It doesn’t know how to say “I don’t know.”
Structurally, a Bayesian Neural Network (BNN) looks similar to a standard neural network. It has inputs, layers, and outputs. But there is a fundamental difference in how it works.
In a BNN, each point estimate weight is replaced with a probability distribution. Typically, it’s a Gaussian distribution (the famous bell curve), but there’s no reason we couldn’t use a different distribution. Instead of a weight being set to exactly “5.2,” the weight is now a range of possibilities (the probability distribution). It might say, “The value is probably around 5, but it could be anywhere between 3 and 7.” Some weight distributions will become very tall and thin (high certainty). Others will be short and wide (low certainty).
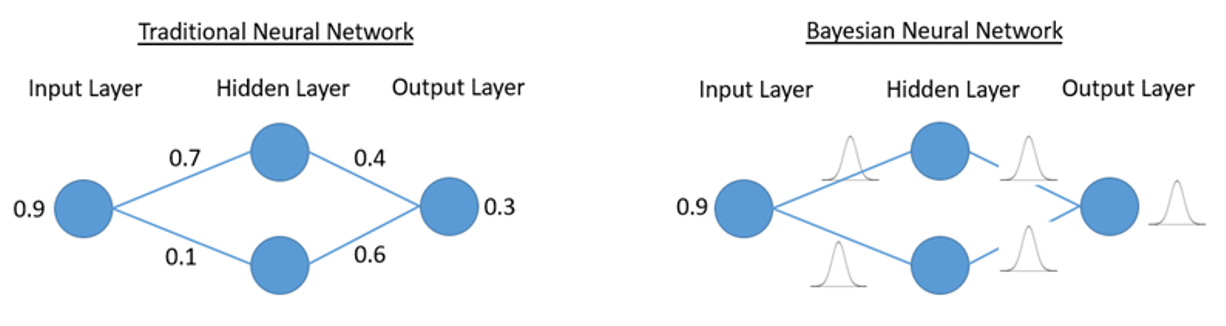
Once a traditional neural network is finished training, the weights are set, and the same input will always lead to the same output. However, the BNN behaves differently. It works via sampling. Each pass through the network draws a plausible value from each of the weight distributions.
Why does this matter? Because it allows us to create prediction intervals. If one of our California homes is passed through the network multiple times, each pass will result in slightly different predictions because different weight values were chosen for each pass. This collection of predictions can be used to create an interval of probable home values.
While a standard network would say “The median home value in this census block is $300,000,” a BNN can say, “We are 95% confident the median home value is between is $250,000 and $350,000”. This creates a layer of transparency critical for uncertainty quantification and decision-making.
To make a neural network Bayesian, Bayes’ Rule requires us to calculate the posterior distribution of the weights given our training data:
However, there’s a major catch. Calculating the denominator – what statisticians call the marginal likelihood – requires integrating over every conceivable combination of weights in the network. For a network with thousands or millions of parameters, this integral is mathematically intractable. We cannot compute the exact answer.
So, how do we get around this? One way is to reframe the problem using Variational Inference (VI).
Variational inference turns our calculations into an optimization problem. Instead of asking, “What is the true probability distribution?” it asks, “Can we find a simpler distribution that looks as much like the true one as possible?”
The key insight is that optimization is often much easier than exact inference. Over the past several decades, researchers have developed powerful algorithms for finding the best solution to optimization problems, even when there are millions of variables. Variational inference takes advantage of these tools, allowing us to approximate probability distributions that would otherwise be out of reach.
Ok, so we’ve decided to use variational inference. How do we know whether our approximation is any good?
One of the most widely used measures is the Kullback–Leibler divergence, usually shortened to KL divergence. If two distributions are identical, their KL divergence is zero. As they become more different, the KL divergence grows larger.
In variational inference, we imagine that the true probability distribution is the one we would like to know, while our variational distribution is our approximation. The KL divergence tells us how much our approximation differs from the ideal answer.
Unfortunately, there’s a major problem. To compute the KL divergence, we would need to know the very probability distribution we are trying to approximate. Fortunately, there’s an elegant workaround. Instead of working with KL divergence directly, we maximize another quantity called the Evidence Lower Bound, or ELBO. The ELBO is a score that can be computed using only the information available to us, and maximizing the ELBO is mathematically equivalent to minimizing the KL divergence.
In other words, although we cannot know the true answer directly, we can optimize a different quantity that leads us toward the same goal.
Now, let’s see how all of this is implemented in code. Again, our goal is to demonstrate the many choices and engineering challenges a practitioner will encounter when deploying a BNN. If you’re interested in experimenting with our networks, you’ll likely find additional performance improvements from changing network size, modifying hyperparameters, and/or combining some of the design choices shown below.
Creating a BNN in Python
One of the first choices you need to make is which Python libraries to utilize. Our example notebooks will leverage Keras and Tensorflow Probability. Pytorch is another great choice worth considering.
The next choice is choosing what statisticians call a prior. This is the probability distribution we want to place over the weights in our network. In classical Bayesian statistics, priors encode domain knowledge. But in a neural network, individual weights lack direct physical meaning and are deeply entangled with other weights. The standard Gaussian distribution (bell curve) is often chosen because it’s mathematically well understood and computationally convenient. However, there’s no deep theoretical reason for choosing a Gaussian and you are free to experiment with any distribution you like.
Tensorflow Probability has a distributions module containing many common probability distributions. We can select the Gaussian (tfd.Normal) and create two functions: a prior – our initial configuration (here we use Gaussians with mean=0 and standard deviation=0.25), and a posterior – Gaussians with learnable means and standard deviations (what the prior will evolve into during training). The complete implementation of this can be found here.
Choosing a different prior
What if we had wanted to go in a different direction and preferred a Laplace Distribution for our weights?
The Laplace Distribution is a so-called heavy-tailed distribution relative to the Gaussian distribution, meaning the Laplace has tails that decay more slowly than the Gaussian distribution. The implication being that the Laplace distribution is narrower at the center but assigns a greater probability to extreme values.
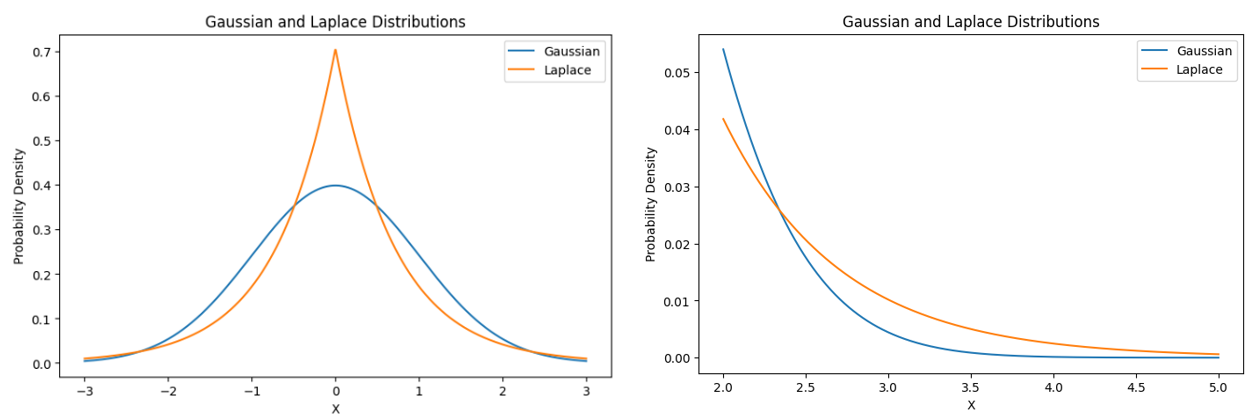
As seen in the code snippet below, similar setup, we just replace tfd.Normal with tfd.Laplace. The complete Laplace implementation is here.
The Mean-Field Assumption and Full Covariance Matrix
The mean field assumption originated in physics and describes how a complex system with many interacting parts can be simplified by replacing all interactions with a single average or effective force. Such simplifications have made their way into Bayesian machine learning. Mean field variational inference is a simplification where we do not account for the covariance between weights in a network. In other words, as each weight is updated during training, it is updated independently from other weights.
Mean field variational inference is computationally efficient. Yet, it often underestimates the total uncertainty because it ignores how variations in one weight affect another. This can lead the network to produce highly confident, incorrect predictions.
You may have noticed the tfd.Independent(…) in the previous code examples. This is the crucial part for the mean-field approximation. It creates independent Gaussian distributions and does not take into account covariance between weights.
Tensorflow Probability has a built-in version of the full covariance matrix for Gaussian distributions: tfd.MultivariateNormalTril(). This will increase the number of learnable parameters. Our initial Gaussian mean field BNN had 1,442 learnable parameters, while this version has 159,434; but it can lead to better uncertainty quantification. The complete implementation of this is available here.
KL Annealing
Training a BNN balances two competing goals: fitting the observed data and keeping the weight distributions close to their chosen prior. This balance is controlled by the aforementioned KL-divergence term. Theoretically, we want to value these two goals equally. In practice, however, this can sometimes make optimization difficult, particularly early in training when the model has not yet learned useful patterns from the data.
KL annealing is a simple technique that gradually increases the influence of the KL term during training. We start with a small emphasis on our weight distributions and a much larger emphasis on fitting the observed data (reducing prediction error). We slowly increase the importance of the weight distributions over the training epochs. A common approach is linear annealing, where the KL emphasis starts at zero and increases linearly until it reaches its full value after some number of training epochs. Thus, annealing changes the path to which we arrive at our Bayesian objective.
There are several possible annealing schedules. Linear annealing is usually the simplest place to start: it is easy to understand and introduces only one important choice – how quickly you want to ramp up to the Bayesian objective. Other possibilities include cosine or sigmoid schedules, which change the rate at which the KL contribution grows. Cyclical annealing repeatedly increases and decreases the KL weight rather than increasing it just once. This approach can be useful because it repeatedly gives the network periods in which it can focus more strongly on fitting the data before reintroducing the prior constraint.
KL annealing is also related to another concept you may encounter in Bayesian deep learning: the cold posterior phenomenon. With annealing, emphasis on the KL divergence is temporarily reduced during training but eventually returns to its standard value. A cold-posterior-like approach, by contrast, deliberately uses a reduced KL importance even after training has converged. In other words, annealing is primarily a training strategy, whereas cold posterior refers to permanently reducing KL importance.
This notebook demonstrates a custom training class for linear annealing.
Evaluating and Interpreting Uncertainty
Because a BNN models weights as probability distributions rather than fixed scalar values, passing the same input through the network multiple times yields distinct predictions. Each forward pass draws a new sample from the weight distributions.
It’s worth noting that the output of our network is itself a probability distribution. A Gaussian in our application. On each forward pass, the model outputs the mean () and variance () of the predicted Gaussian. We obtain a collection of mean and variance pairs that capture both prediction and model uncertainty in that prediction. Aggregating this collection of mean and variance pairs yields a final point prediction and uncertainty bounds. Formally, we have:
We prefer a sampling technique to construct a 95% prediction interval, which is demonstrated in the notebooks. An example from our test data yields:
Predicted median home price: $75,410.
Actual median home price: $79,300
95% prediction interval: ($8007, $137808)
A visual representation of predictions and uncertainty intervals is shown below.
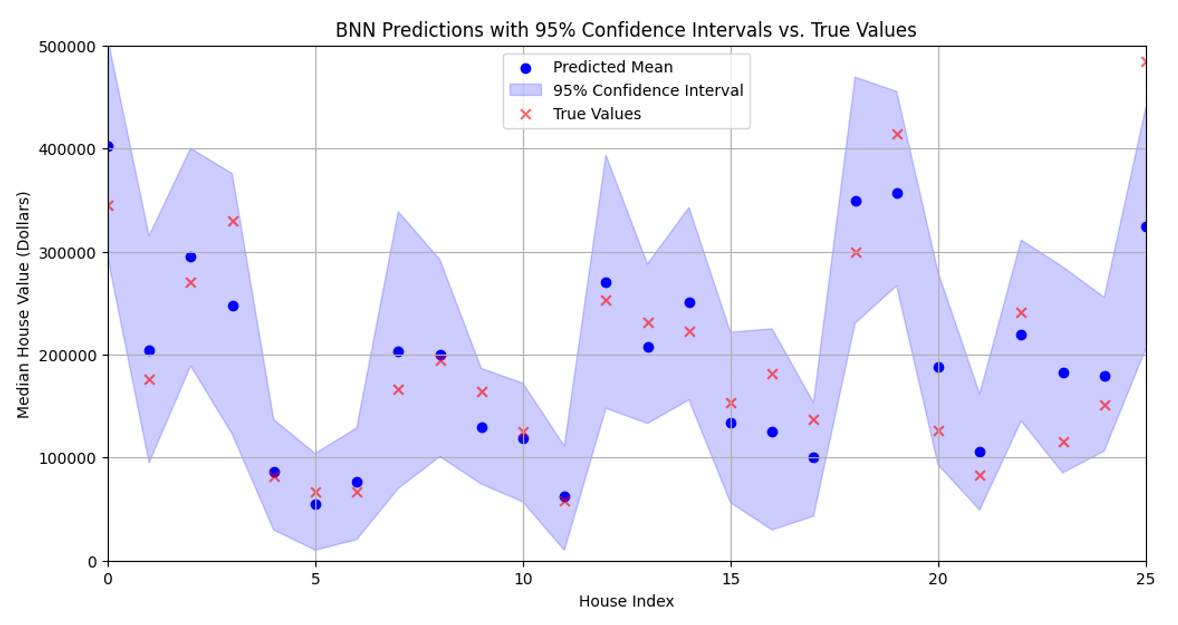
Two additional metrics commonly used in assessing BNNs are coverage and mean prediction interval width. If we’re creating a 95% confidence interval, then 95% of the true median home values in our test data should fall within their predicted intervals. Coverage is the percentage of true median home values in our test data actually falling within their predicted intervals. Ideally, we want those prediction intervals to be as narrow as possible. A BNN that is always uncertain (produces wide prediction intervals) has limited practical utility. As a result, it’s also helpful to report the mean interval width.
Results and Practical Takeaways
So, how did our various BNNs perform? The table below summarizes results across our various configurations. The prediction intervals are rather large, as each of our notebooks was intended to highlight a specific aspect of BNNs and not a fully optimized production system.
|
|
Mean Absolute Error |
Mean Interval Width |
Coverage |
|
Gaussian Prior |
$46,464 |
$290,103 |
98.9% |
|
Laplace Prior |
$37,152 |
$202,569 |
96.0% |
|
Full Covariance Matrix |
$39,801 |
$227,040 |
96.7% |
|
KL Annealing |
$36,502 |
$189,001 |
94.8% |
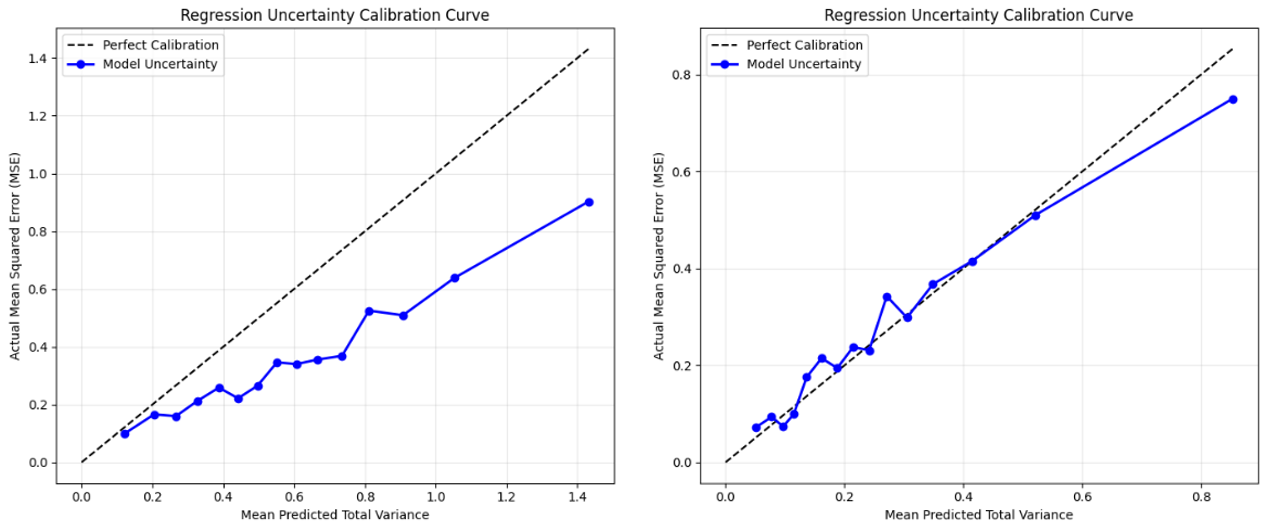
Another way of looking at how well our BNNs are performing is via calibration curves. The total variance reflects our uncertainty, and we’d expect this value to correlate with error. Homes with larger total variance should have larger discrepancies between their predicted and actual median value on average. We can see this reflected in the graphs below, where the Gaussian with KL-Annealing BNN (right) is much better calibrated than our initial BNN with Gaussian weights.
One of the main benefits of quantifying uncertainty is that we can use it to make informed decisions. Perhaps we only want to predict the median home value for census blocks we’re certain about. This is where the total variance value can be used as a filter. As an example, we only reported predictions for homes in our test set having a total variance < 0.25. The table below shows the original mean absolute error (MAE) and mean prediction interval widths as well as how these values dropped when predictions were limited to data the BNN was certain about.
|
|
MAE |
MAE on Observations with Total Variance < 0.25 |
Mean Interval Width |
Mean Interval Width on Observations with Total Variance < 0.25 |
|
Gaussian Prior |
$46,464 |
$29,741 |
$290,103 |
$159,753 |
|
Laplace Prior |
$37,152 |
$25,736 |
$202,569 |
$137,044 |
|
Full Covariance Matrix |
$39,801 |
$27,422 |
$227,040 |
$155,083 |
|
KL Annealing |
$36,502 |
$26,921 |
$189,001 |
$142,453 |
The primary value of a Bayesian Neural Network is that it tells you when to trust your predictions. Uncertainty quantification puts risk management directly into the analyst’s hands. Developing tolerance thresholds on total variance or interval widths allows practitioners to safely automate decisions on confident data points while withholding, flagging, or routing high-uncertainty estimates for human review. Real estate valuation may not be a high-stakes domain. Yet, it’s an illustrative example of how we can begin to quantify the limits of our model’s knowledge.
References and Additional Resources
GitHub repository with our example notebooks
Variational inference isn’t the only way to quantify uncertainty
-
Monte Carlo Dropout uses traditional neural networks and randomly turns off nodes during inference
-
Markov Chain Monte Carlo is a more direct, but computationally intensive, approach
-
One could also use an ensemble of traditional neural networks
The California Housing Dataset originated from:
Pace, R. Kelley and Ronald Barry, Sparse Spatial Autoregressions, Statistics and Probability Letters, 33:291-297, 1997