


In September 2025, Horace He and colleagues at Thinking Machines Lab ran a simple experiment. They sent the prompt “Tell me about Richard Feynman” to Qwen3-235B 1,000 times at temperature 0 and asked for 1,000 tokens each time. Temperature 0 means the model always picks its most probable token, so you would expect 1,000 identical answers. They got 80 unique completions.
What caught my eye is where the answers split. All 1,000 completions were identical for the first 102 tokens. At token 103, 992 of them continued with “Queens, New York” and 8 with “New York City.” Eight runs in a thousand flipped at a single token, after 102 tokens where none did.
Their post explains why outputs differ at all. This article asks a different question: how often should a token flip, and why does that risk arrive in sudden spikes? I’ll derive a one-line formula, check it with a simulation, and test it on a real model. Everything runs on a laptop, and the code is in the article.
Where the noise comes from
At temperature 0 the model picks the token with the highest logit (its raw score). That is deterministic mathematics, but your computer computes logits in floating point, where addition is not associative:
At scale it gets worse. I summed 100,000 random float32 numbers three ways. Forward order gave −90.82497, reverse order gave −90.82674, and NumPy’s pairwise sum gave −90.82513 (a float64 reference gives −90.82508). Same numbers, three answers.
A neural network is billions of such sums, so the order the hardware uses matters. A popular explanation blames GPU threads that finish in random order. He et al. show that this isn’t the main cause: a typical LLM forward pass contains essentially no atomic adds, and the same kernel on the same input returns the same bits every time. The real culprit is that many kernels aren’t batch-invariant. Their reduction order changes with the batch size, and on a shared server the batch size depends on how many other people are sending requests at that moment. Your answer depends on strangers.
The authors note that this isn’t specific to GPUs, and that with batch-invariant kernels all 1,000 Feynman completions came out identical. The fix has a price: in their serving test (Qwen-3-8B on one GPU), the unoptimized deterministic version took 55 seconds against 26 for default vLLM, and 42 after an improved attention kernel.
Only near-ties matter
Here is the part that interests me as a mathematician. Let z₁ and z₂ be the two largest logits, and call their difference the gap, . Numerical noise changes that gap by a small error Δ, and the argmax flips only if .
A token with a gap of 8 logits will never flip, however noisy the kernel. Only near-ties are at risk. Averaging over all positions, with f the density of gaps, the flip probability is
p = ∫ P(Δ < −m) f(m) dm
If the noise is small, f is roughly constant, equal to f(0), over the narrow range where isn’t negligible. The integral of over is the expected negative part of the error, which is for symmetric noise. So
p ≈ f(0) · E|Δ| / 2
The flip probability per token is how crowded the neighbourhood of a tie is, times how large the noise is. The first factor belongs to the model and the text. The second belongs to your hardware, precision and kernels. This is an elementary small-noise argument, so I make no claim of novelty. A related formalization, the “background temperature” of Messina and Scotta (TMLR, 2026), treats such perturbations as an effective temperature.
Does the formula hold?
Before touching a real model, I checked the formula on simulated gaps with a known density and Gaussian noise of known size . The core is nine lines:
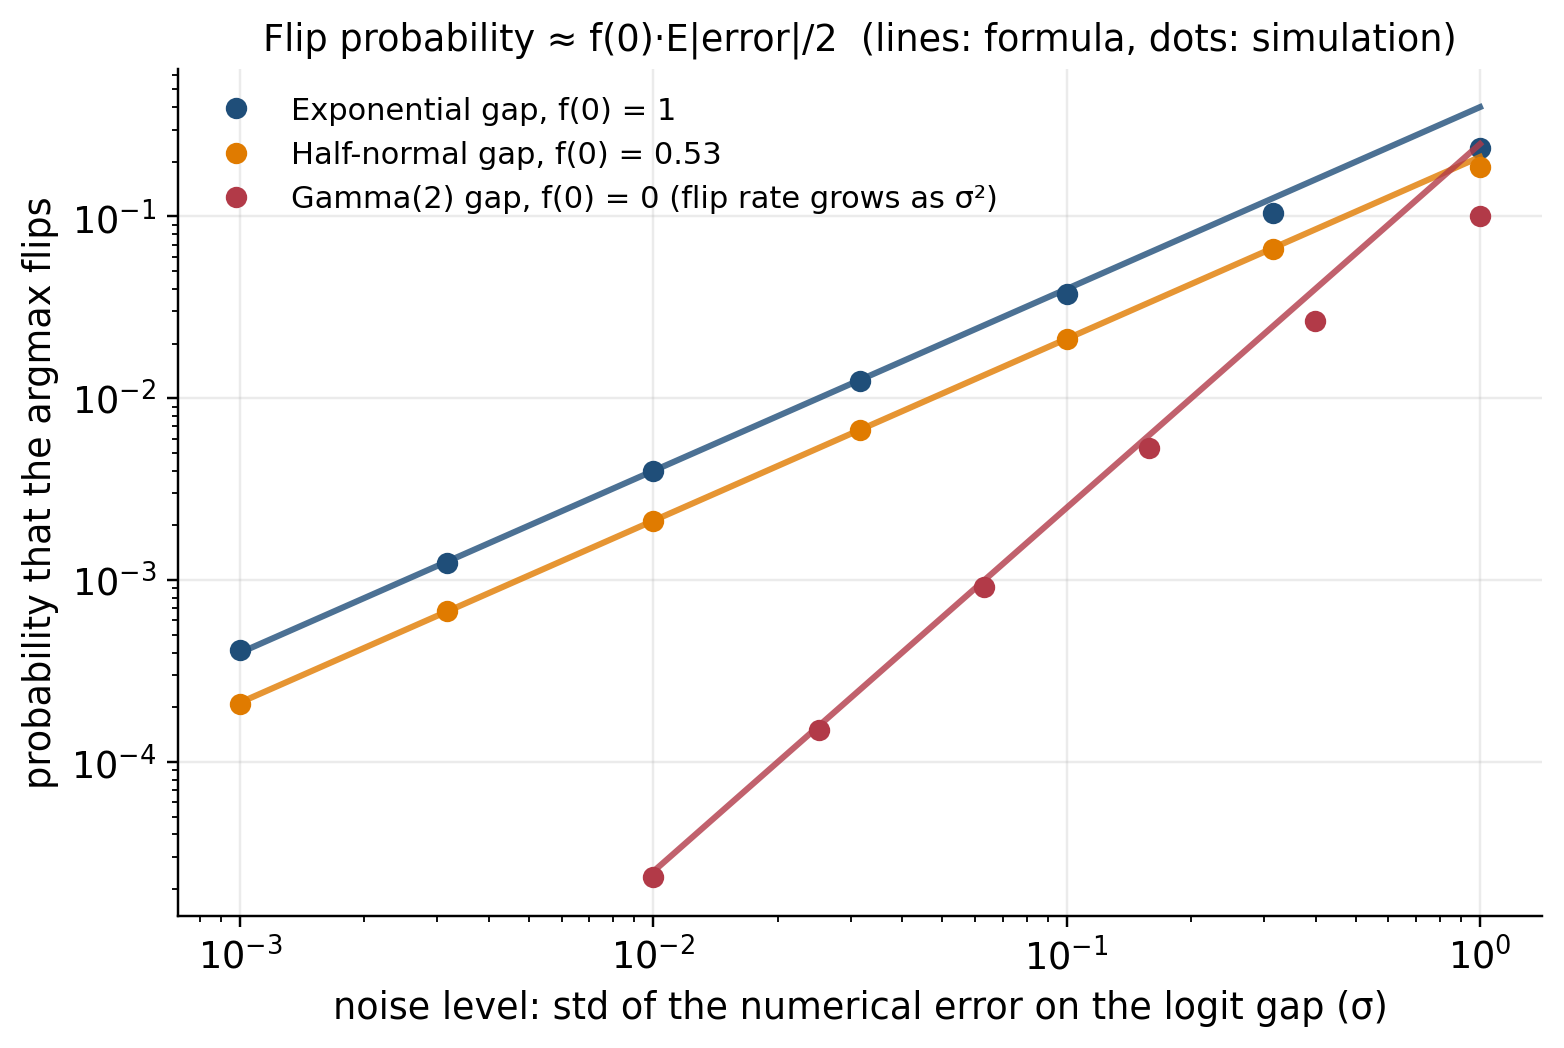
For an exponential and a half-normal gap, the simulation matches the formula within 4% for σ up to 0.03, and the half-normal stays within 2% even at σ = 0.3 (Figure 2). It breaks when the noise is as large as the typical gap: at σ = 1 the exponential case flips 24% of the time against a predicted 40%, because the density is no longer flat over the region that matters.
A third case shows the formula’s key assumption, . If the gap density vanishes at zero, the flip rate grows like instead (it matches within 8% for σ up to 0.06), and noise matters far less. So which regime does a real model live in?
A real model
I ran GPT-2 on 256 windows of 128 tokens from WikiText-2 and compared a forward pass with an one. This is a stand-in for realistic serving noise: my laptop can’t reproduce the batch-size effect of a loaded GPU server, but it can measure the logit error a lower-precision kernel produces. I run the transformer body in and the output projection in , so the final logits aren’t rounded to ‘s coarse grid.
For every position I keep the top-20 logits, the gap, the error on that gap in the run, and whether the argmax flipped. (Plotting code omitted.)
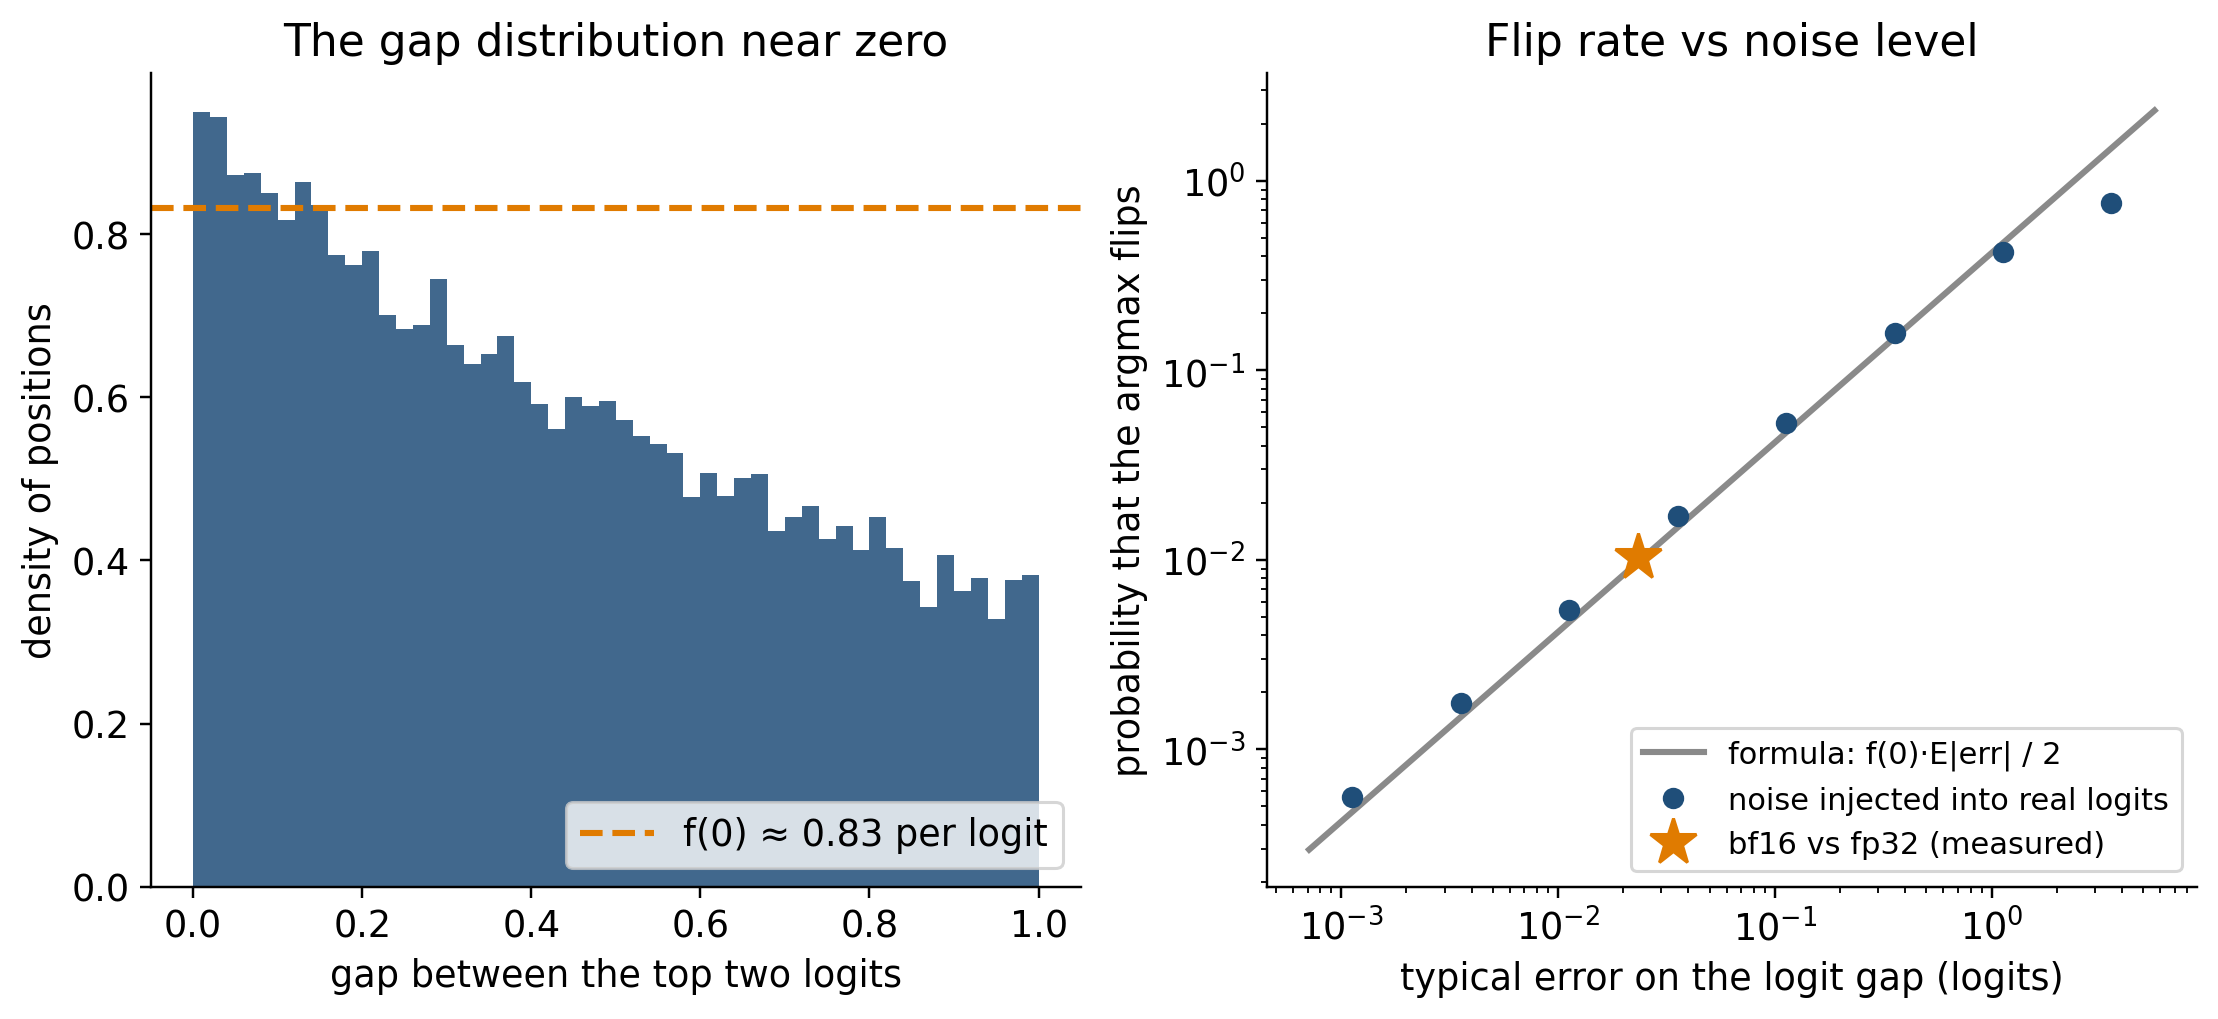
The density of the gap at zero is per logit, and of positions have a gap below 0.1 logits. The error on the gap near ties averages logits, so the formula predicts a flip rate of . I measured . Figure 3 (right) repeats the comparison across noise levels by injecting Gaussian noise of known size into the real logits.
From tokens to completions
For one completion, survival is a product of per-token survival probabilities, . If every token carried the same risk , that would be , and half of all completions would have split by token ln . Real text isn’t like that.
Take the Feynman numbers (this is my arithmetic on their published counts). Over the first 102 tokens, 1,000 runs produced zero disagreements. That is about 102,000 token decisions with no flip, so the average per-token flip rate over that stretch is at most about 3×10⁻⁵ (the “rule of three” 95% bound). At token 103 the rate was 8 in 1,000, or 0.8%. That is more than 250 times higher, at a single token. Risk isn’t spread evenly. It sits on a few knife-edge tokens, with long stretches of near-zero hazard in between.
Prompts also differ in how many knife-edge tokens they contain. To see what that does to survival, I simulated a mean per-token flip rate of 0.005 with fragility varying across prompts (lognormal, log-sd 1):
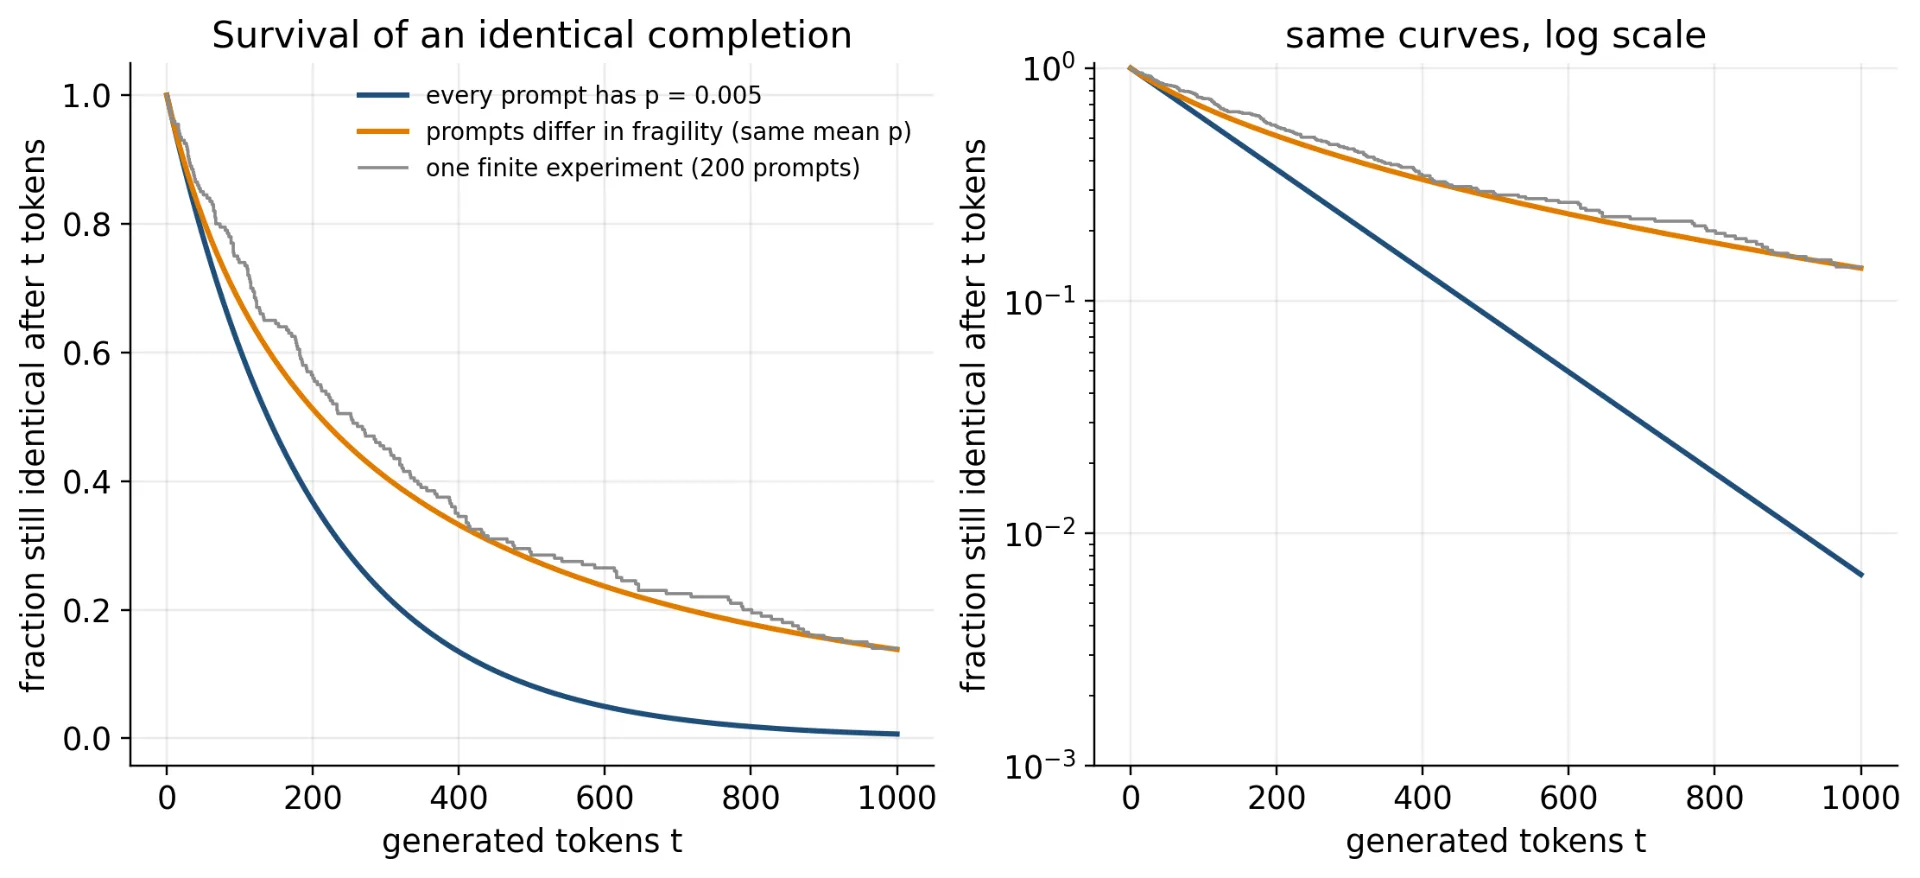
If every prompt had p = 0.005, half of the completions would split by token 139 and 8% would still match at token 500. With the same mean but varying fragility, the median moves to token 210 and 28% still match at token 500. The average flip rate alone doesn’t tell you how long a completion survives. The spread of fragility matters too.
Where this breaks
-
My noise isn’t your server’s noise.
bf16againstfp32on a laptop reproduces the size of a precision error, not the batch-size mechanism of a loaded GPU cluster. These numbers describe the model, not any hosted API. -
Two tokens only. The formula ignores the third-best token and assumes the error is symmetric and independent of the gap.
-
A flip isn’t an error. Many flips swap near-equivalent phrasings. The formula says how often outputs differ, not how often they get worse.
What to do with it
Predict your flake rate. If your stack has a per-token flip rate p, a completion of L tokens differs between runs with probability about . With p = 10⁻³ and 500-token answers, that is about 39%. Measure f(0) on your model and the noise on your stack, and you can estimate it before shipping an eval.
Don’t assert exact equality on temperature-0 outputs. Compare with a tolerance, or grade semantically. If you control inference, batch-invariant kernels remove the effect for a throughput price. If you don’t, assume two identical calls can differ.
Takeaways
-
Temperature 0 is deterministic in the mathematics, not in the arithmetic.
-
Only near-ties matter: the per-token flip probability is about the crowding of ties times the noise level.
-
Risk is spiky. A few knife-edge tokens carry most of it, which is why completions stay identical for a stretch and then split.
···
Sources and credits
-
He, Horace and Thinking Machines Lab, “Defeating Nondeterminism in LLM Inference”, Thinking Machines Lab: Connectionism, September 10, 2025. https://thinkingmachines.ai/blog/defeating-nondeterminism-in-llm-inference/ (source of the Feynman experiment and its counts, the batch-invariance explanation, and the serving timings).
-
Messina, Alberto and Scotta, Stefano, “Introducing Background Temperature to Characterise Hidden Randomness in Large Language Models”, Transactions on Machine Learning Research, 2026. https://openreview.net/forum?id=bz0he4bARF
-
Radford et al., “Language Models are Unsupervised Multitask Learners” (GPT-2), 2019, and Merity et al., “Pointer Sentinel Mixture Models” (WikiText-2), 2016, both used through Hugging Face Transformers and Datasets.
-
The flip-probability formula, simulations, real-model experiment, figures and the arithmetic on the Feynman counts are the author’s own.