

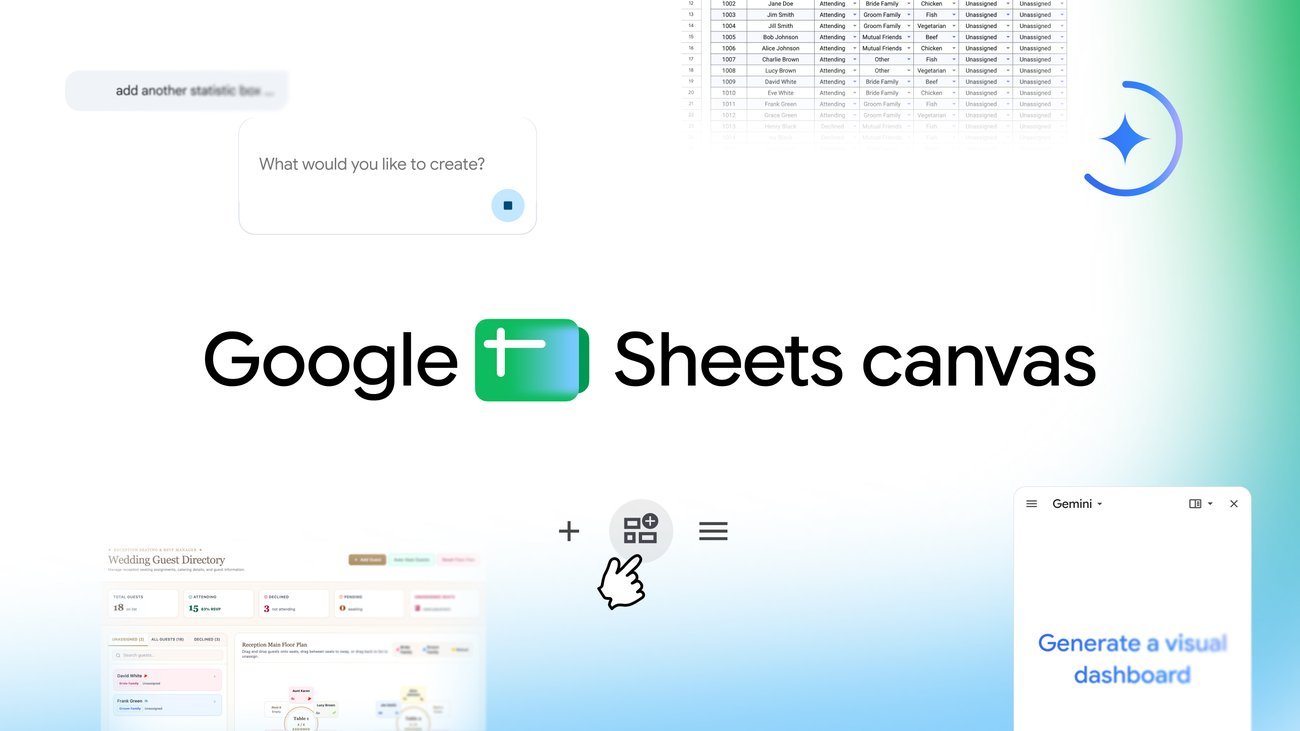
Spreadsheets are a powerful tool for organizing and understanding data, but staring at hundreds of rows and columns can sometimes feel a bit overwhelming. Whether you’re planning a wedding, tracking school assignments, managing a fantasy football roster, or comparing side hustle income, you want to see what you need to know from your data quickly.
To help get you there, we’re introducing Sheets canvas, a new feature built with Gemini that turns your Google Sheets spreadsheets into custom, interactive “mini-apps.” With a simple natural language prompt, you can transform your data into a visual experience that’s easy to understand and even easier to use.
Visualize your data in new ways
Sheets canvas is a dynamic, read-write layer that sits directly on top of your spreadsheet data. This means that you can visually organize, edit, and navigate your data in whatever layout you imagine.
Here is what makes it so powerful.
- No coding required: No formulas or programming required. Just describe what you want — like “create a visual study tracker” — and Gemini builds it for you.
- Always in sync: Whether you make changes to your canvas or to your sheet, updates are synced between the canvas and the original sheet in real time.
- Easy to adjust: You can continue to polish and refine your Sheets canvas by prompting Gemini to make edits to layout, design, functionality, and more.
- Fully collaborative: Since it lives as a tab in Google Sheets, your canvas can be shared with anyone, just like a regular sheet.
See it in action
We designed Sheets canvas to be as flexible as your imagination. Here are a few examples to show how you can start using it today.