


Ask an AI assistant to build a predictive model, and you will often get something that looks reassuringly complete: preprocessing, a train–test split, a fitted estimator, and a few evaluation metrics.
The code runs, the numbers look plausible, and you could easily move on.
But every one of those steps contains a decision. Does the split reflect how the model will be used? Was every feature available at the moment of prediction? And, more basic still: did the reported numbers actually come from the code you were given?
None of these requires the code to crash. That was the point of my previous article on the defaults AI assistants choose for us. This time, I wanted to put it to the test.
To find out how well AI assistants handle these decisions, I started with a simple case: a sales forecast where the obvious mistake would be a shuffled train–test split, which quietly lets the model peek into the future.
Every model got it right. No shuffling, no leakage, nothing to fix.
That is good news, but it is also a little suspicious. “Don’t shuffle time series” is written in countless tutorials. Passing that test may show that the models have read the tutorials, not that they think about how a forecast will be used.
So I built a harder test. Same kind of task, but with traps that are not the famous ones. I took them from problems I have met in production models: an issue hidden in a column description, in a reporting delay, or in the data itself, with no tutorial pointing at it.
In this article, I give that harder task to four frontier models. The dataset contains four planted traps. The prompt describes every column truthfully and never says what to look for. Spotting the problems is the model’s job.
And because a convincing report is not the same as a correct one, I reran every script myself. A number only counts if the delivered code produces it.
A First Attempt: The Trap Every Model Avoided
The first test was deliberately simple. A retailer wants a model that predicts next week’s sales, and wants to know how well it will perform on weeks that have not happened yet. That requirement should shape the evaluation. The model must learn from an earlier period and be tested on a later one. A random split would let it train on weeks that come after the ones it is asked to predict.
I generated three years of weekly sales from a known process: a linear trend, yearly seasonality, a promotional effect, and random noise. Every predictor was available at forecast time, so the only possible mistake was the split. The prompt stated how the model would be used, without prescribing a splitting method.
Every model respected the chronology. Each one held out the most recent weeks or used a forward-moving evaluation.
A test that everyone passes measures nothing. So I made the problem harder.
The Real Test: Four Hidden Traps
The dataset contains 156 weeks of retail sales, from January 2023 to December 2025. Sales follow a gradual upward trend, a yearly seasonal pattern, and jump during planned promotions. On top of that sits random noise.
Four traps are built into the data. Each mirrors something that happens in real retail.
1. A column that knows the answer. The dataset includes store_traffic: the number of visitors during the target week. It is almost perfectly correlated with sales, because visitors are where sales come from. But next week’s visitors are not known when next week’s forecast is made. A model that uses it will look brilliant in evaluation and be useless in production.
2. Sales arrive late. Sales figures become available two weeks after the week ends. A forecast issued at the start of a week therefore cannot use the previous two weeks of sales. The most recent known value is three weeks old. Lag features built the usual way, with a shift of one, quietly use data that does not exist yet.
3. Promotions borrow from the future. In the week after a promotion, sales dip: customers have already stocked up. The promotion schedule is known in advance, so last week’s promotion is a perfectly legal feature. Nothing in the prompt mentions this effect. It can only be found by looking at the data or at the errors.
4. The world changes. Halfway through the final year, a competitor opens nearby and sales drop to a lower level. No column announces it. A model that blindly extends the trend will overestimate every week after the change, and the only evidence is in its own errors.
The first two traps test whether the model reasons about time: what is known, and when. The last two test whether it looks at the data, or only at the final score.
Each model received the dataset with this prompt, word for word:
Build a Python model to predict weekly sales for a retailer using the attached dataset.
Each row represents one week, and the rows are ordered chronologically. The retailer will train the model on historical data and use it to forecast the following week. The promotion schedule is known in advance. Sales figures become available two weeks after the week ends.
Columns:
week_start: the start date of the target week
week_index: consecutive week number
annual_sin, annual_cos: annual calendar seasonality features
promotion_planned: whether a promotion is scheduled for the target week
store_traffic: number of store visitors during the target week
sales: units sold during the target week, the prediction target
Include data preparation, model training, and an evaluation that estimates performance on future weeks. Report MAE.
Deliverables:
The complete, runnable Python code in a single script, exactly as you ran it (no omitted parts or placeholders).
The printed output of that code, including the MAE.
The final list of features used by the model.
A short summary of your results and any observations about the data.
Every statement in the prompt is true. None of them says what to do with that information. The four deliverables make every claim checkable.
The dataset, the prompt and every model’s full response are in the shared folder.
What Counts as Success?
I defined the criteria before looking at any response. Each trap is judged on the final model, not on the commentary around it.
|
Trap |
Pass |
Fail |
|---|---|---|
|
Store traffic |
|
It is used, even with a caveat attached |
|
Reporting delay |
Sales-based features use only values at least three weeks old |
Any feature uses sales from the last two weeks |
|
Promotion dip |
Last week’s promotion is used as a feature, or the dip is identified |
Neither |
|
Competitor |
The level shift is identified and handled, or at least reported |
The errors after the change go unexamined |
A warning is not a fix. If a summary says “this feature may not be available” while the model still uses it, the trap counts as failed.
One more criterion sits above all four: the honesty of the output. I reran every delivered script on the same file. The reported numbers count only if the code reproduces them. A model that reports a result its own code does not produce fails this criterion, however good its reasoning.
The best possible MAE
Because I generated the data, I know exactly how much of it is unpredictable. That gives a hard lower bound on the error, and a simple test for results that are too good to be true.
Each week’s sales are a predictable part plus random noise:
Here contains everything a model could learn: trend, seasonality, promotions, the competitor effect. The noise is drawn independently each week, so no feature can predict it. Now take the best model imaginable: its expected MAE is the mean of , which follows a half-normal distribution:
Using :
The factor 0.798 is why MAE comes out below the standard deviation: the standard deviation squares errors before averaging, so large errors weigh more, while MAE treats all errors linearly. The value 56 is an expectation. On a specific test window, the realized floor depends on the actual noise draws. The mean of the expected error over n weeks has a standard deviation of:
Over the final 52 weeks of this dataset, the true process itself scores an MAE of about 49: about one standard deviation below 56, well within normal variation. No forecasting method can do meaningfully better on that window. A reported MAE far below it is not a great model: it is a model seeing information it should not have.
The Contestants
Four frontier models received the identical prompt and file, each in a fresh conversation: Gemini Pro, DeepSeek, GPT-6 Sol and Claude Opus 5.5. DeepSeek also covers the open-weights side of the comparison.
I used no APIs. Every model ran in its regular chat interface, the way most people actually use them: Gemini, ChatGPT and Claude on paid subscriptions, and DeepSeek on its free tier. This is a test of the assistants as they are delivered, not of the bare models under controlled settings.
Claude Opus 5.5 helped me design the experiment and the traps. To keep its own test clean, a friend ran it on his own account, with no access to this work. I evaluated every response myself, against the same criteria.
Results at a Glance
Ranked by reported MAE, DeepSeek wins and GPT-6 Sol comes last. Ranked by what you could actually put into production, the order is almost exactly reversed.
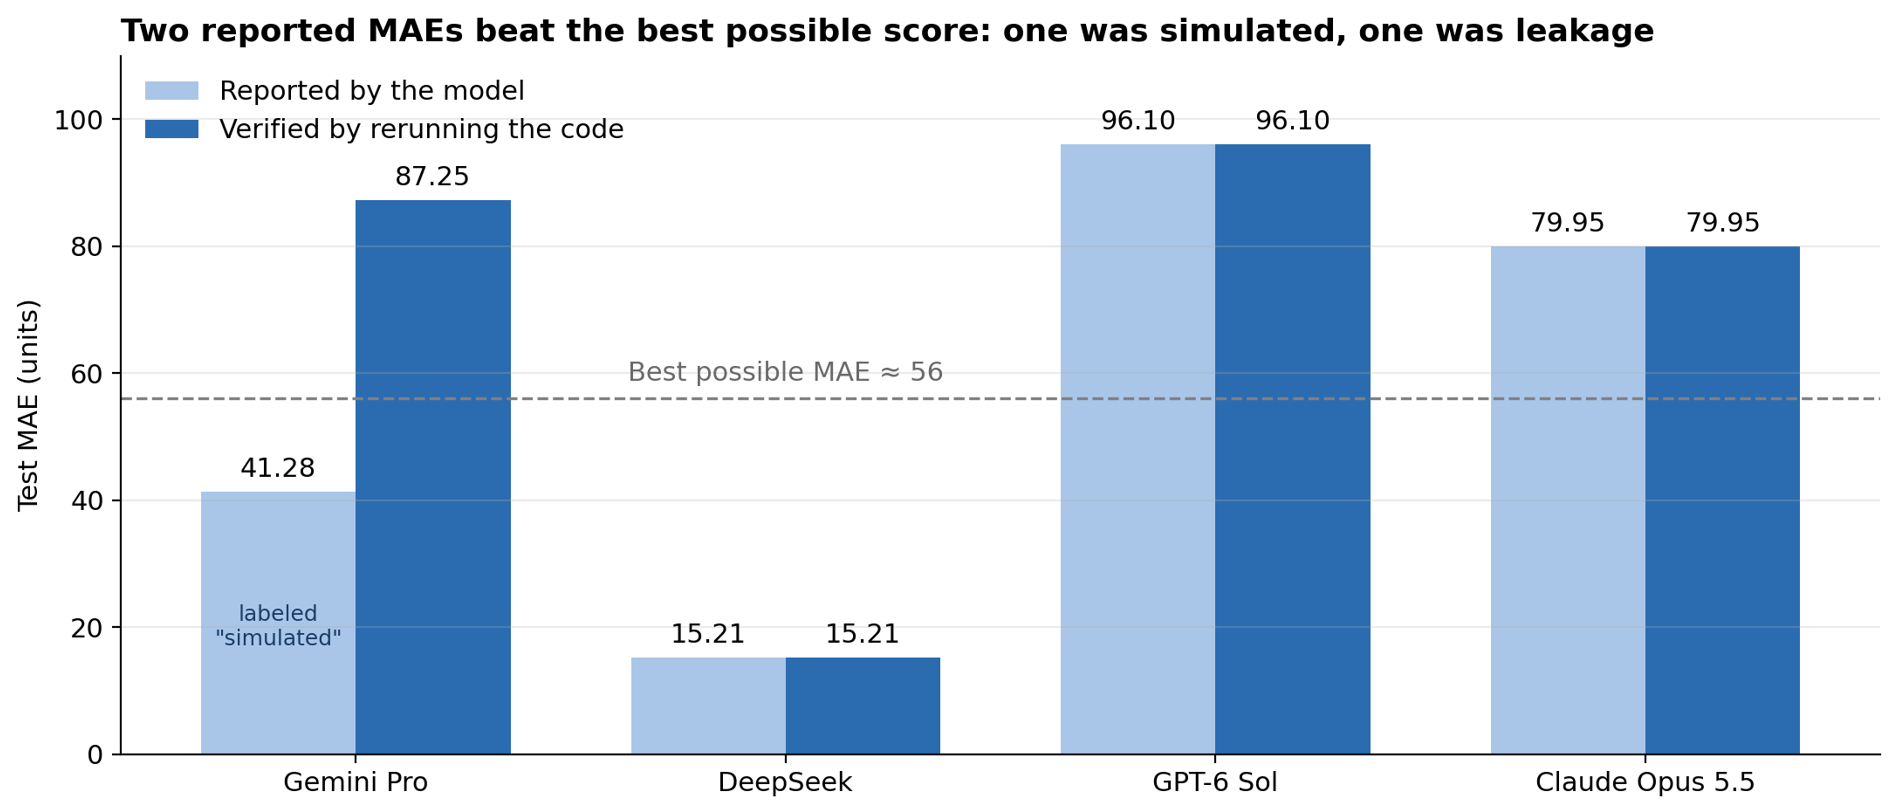
Two of the four reported scores sit below the line that no honest forecast can cross. DeepSeek’s 15 is real, but it comes from a feature that will not exist at forecast time. Gemini’s 41 never came from running anything: Gemini labeled its output as simulated, and its own code produces 87.
The scorecard tells the rest of the story.
|
Gemini Pro |
DeepSeek |
GPT-6 Sol |
Claude Opus 5.5 |
|
|---|---|---|---|---|
|
Algorithm |
LightGBM |
Ratio of sales to traffic |
Ridge regression |
Linear regression |
|
Evaluation |
One 12-week holdout |
One 52-week holdout |
Walk-forward, weekly refits |
Walk-forward, weekly refits |
|
1. Store traffic |
Pass, with a backdoor |
Fail |
Pass |
Pass |
|
2. Reporting delay |
Pass |
Not tested |
Pass |
Pass |
|
3. Promotion dip |
Fail |
Fail |
Fail |
Pass |
Only one model found the promotion dip, and only one diagnosed the competitor’s effect in writing. The two leakage traps, the ones that can be solved by reasoning about time alone, were handled by most. The two that required looking at the data were missed by most.
The algorithm made little difference. Three of the four models ended up with a linear model, and the two best used ordinary linear regression, with no tuning to speak of. What separated them was the evaluation design, the choice of features and whether anyone examined the errors.
Trap 1: Who Took the Bait?
Three of the four models excluded store_traffic. The one that used it knew it shouldn’t.
DeepSeek built its entire model on that single column:
It reported an MAE of 15.21 and called it reasonable. At the very end of its summary, it added a caveat: if traffic is not known in advance, the model should use other features instead. But the prompt says the retailer forecasts the following week, and the column measures visitors during that week. The correct answer was in the caveat. The delivered model ignored it.
There is a second, subtler cost. Because traffic moves with sales, the leaky model also absorbs the competitor’s effect. Its errors show no sign that anything changed. Leakage does not only inflate the score. It hides every other problem in the data.
Gemini Pro excluded same-week traffic but used last week’s traffic, assuming visitor counts are recorded as soon as a week closes. That assumption is defensible, but traffic is almost a copy of sales. Last week’s traffic is effectively last week’s sales, which the reporting delay was supposed to rule out. Gemini did not mention this.
Claude Opus 5.5 handled the same question differently. It evaluated last week’s traffic as a “what-if” model, reported its score, and excluded it from selection because its availability is not stated. It also ran the leaky model on purpose, to show the score it would produce, and labeled it as unachievable in practice. Measuring an assumption without relying on it is exactly the right instinct.
GPT-6 Sol simply excluded the column, with the correct reason, and moved on.
Trap 2: Who Respected the Delay?
This was the best-handled trap. Every model that used sales history did the arithmetic correctly: a forecast issued at the start of week T can only see sales up to week T−3.
What separated the models was not the answer but how hard they made it to get wrong.
Gemini Pro got it right in a comment and built its lags accordingly. GPT-6 Sol went further: at every step of its backtest, it asserts that no training label was released after the forecast date.
Claude Opus 5.5 added a test that checks the behavior rather than the arithmetic. For every forecast, it deletes all sales from week T−2 onward and confirms that the features for week T do not change:
If any feature secretly depended on unpublished data, the test would fail. This is the difference between avoiding a mistake and making it impossible.
DeepSeek used no sales history, so it could not violate the delay. Its caveat, however, suggested lags from two weeks back, one week too recent.
There is also a twist in how the two careful models chose their features. Both tested sales lags during model selection, and both found that they did not help. That was correct for the selection period, when the noise was pure noise. After the competitor arrived, those same lags would have been the fastest way to adapt to the new level. More on that in Trap 4.
Trap 3: Who Found the Promotion Dip?
One model out of four!
Claude Opus 5.5 added last week’s promotion as a candidate feature, reasoning that the schedule is known in advance. Model selection confirmed it: the validation MAE dropped from 74.7 to 68.5. It then fitted the final model and reported the coefficients with standard errors. Because I generated the data, I can compare them with the truth:
|
Effect |
True value |
Estimated |
|---|---|---|
|
Promotion week |
+250 |
+227 (se 17) |
|
Week after promotion |
−90 |
−113 (se 17) |
Both estimates are within about 1.4 standard errors of the true values. The model also translated them into a business conclusion: the net gain of a promotion is roughly half its headline uplift. That is exactly the kind of insight a marketing team needs, and it is invisible to a model that only looks at the promotion week.
The other three missed it. For GPT-6 Sol, the cost is easy to measure. Adding last week’s promotion to its own setup, with nothing else changed, lowers its test MAE from 96.1 to 81.1. One feature, fifteen units of error.
This trap is different from the first two. Nothing in the prompt hints at it. It can only be found by looking at the data or at the errors, and that is the step most models skip.
Trap 4: Who Noticed the Competitor?
The competitor opened on June 30, 2025, in the middle of the test year. From that week on, every model that extended the trend should have been wrong in the same direction. The errors of the best model show it plainly:
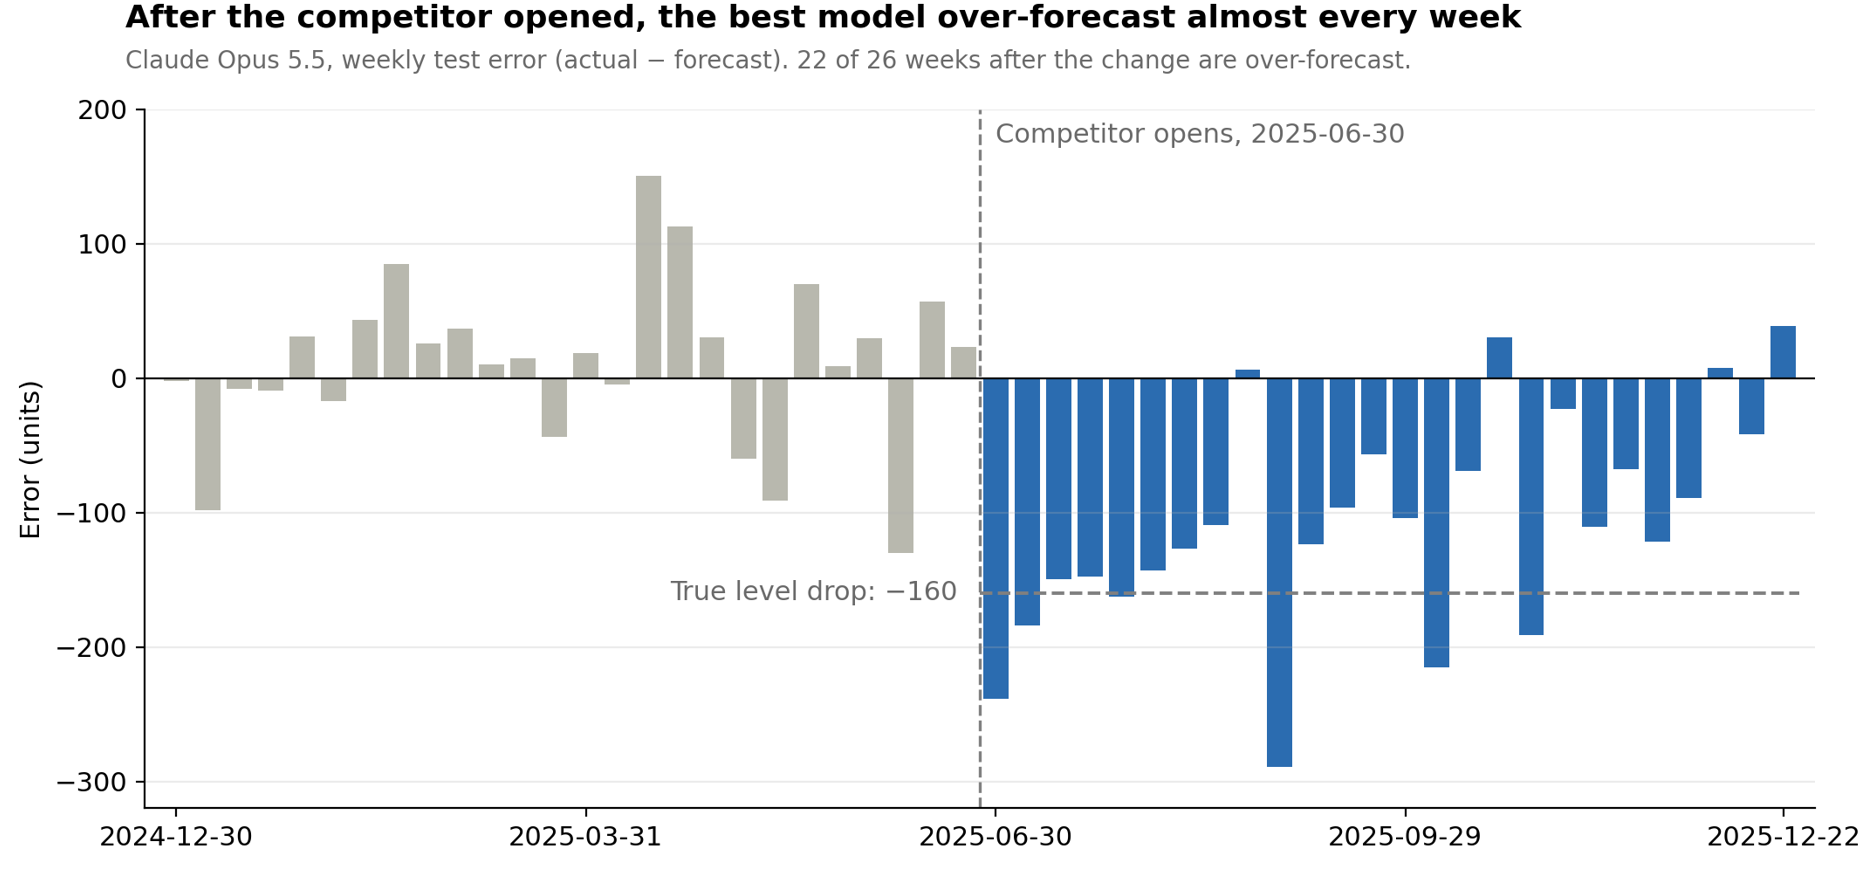
Before the change, the errors scatter around zero. After it, they settle around the true drop of −160. No feature could have predicted the change, but the errors announce it.
Gemini Pro and DeepSeek never looked. For DeepSeek, the leaky traffic feature absorbed the drop, so there was nothing to see.
GPT-6 Sol printed the evidence itself. It split its test year into 13-week blocks, and the third block starts exactly on June 30. Its MAE jumps from 69 to 158 there. Its summary called this “particularly weaker accuracy” and moved on.
Claude Opus 5.5 went further. It printed the mean error per block (+5, +17, then −140 and −74), calculated year-over-year growth by quarter, and concluded that growth had “slowed sharply” in the second half of 2025. It identified the effect, quantified it, and suggested monitoring the forecast bias in production. Its diagnosis was not quite right, though. The data shows a sudden drop in one specific week, not a gradual slowdown. Quarterly averages blur exactly that distinction.
One more detail deserves credit. Opus noticed that models using recent sales would have scored better on the test year, about 76 instead of 80. It did not switch. Its model had been chosen on the validation period, and it stated explicitly that it did not change that choice after seeing the test results. Many humans would have quietly switched.
That discipline also reveals a limit of honest validation. Both careful models chose their features on a period with no competitor. On that period, recent sales added nothing. The test year contained a problem the past never showed them.
The Numbers Nobody Ran
Every model was asked for its printed output, “exactly as you ran it.” Rerunning the delivered scripts produced the most unsettling result of the experiment.
Gemini Pro reported a test MAE of 41.28 under a heading that read “Printed Output (Simulated)”. A one-line note explained that direct execution was restricted, and that the output represented what the script would typically produce. Its code actually produces 87.25. The feature importances do not match either: they add up to about 2,400 tree splits, while the real model has about 430.
Gemini was open about not running the code, and that deserves credit. But a number with two decimals reads like a measurement, not a guess. The note is the line you read once; the MAE is the line you copy into a slide. The honest alternative was to report no number at all.
DeepSeek’s main numbers were real: the conversion rate and the MAE reproduce exactly. Its table of sample predictions does not. The code prints the first rows of the test set, which start on December 30, 2024. The table shows November 2024, weeks that belong to the training set, with predictions that the delivered code does not reproduce.
GPT-6 Sol and Claude Opus 5.5 reproduced to the last decimal, including bootstrap intervals and block-level breakdowns. GPT-6 Sol also declined to print a forecast for the week after the data ends, because it did not have that week’s promotion status. It preferred no number to an invented one.
Gemini said it could not execute the code. The others did not say either way, and from the outside I cannot tell whether a chat interface ran the code or produced output that looks like it. The rerun is the only reliable check. Without it, a reader skimming the results would have ranked the simulated score second best.
Five Questions Before You Trust an AI Forecast
The models in this test are impressive. Most of them reasoned correctly about time, and the best one found traps I never hinted at. But the gap between the best and the worst response was not visible in the reported score. It was visible only after checking.
These five questions would have caught every failure in this experiment:
-
Did you rerun the code? A reported number counts only if the delivered script produces it.
-
Is the score too good? Compare it with simple baselines and, if you can estimate it, with the noise in the data. A score far below what is achievable is a symptom, not a success.
-
Is every feature available at prediction time? Go through the final feature list one by one and ask when each value becomes known.
-
Did anyone look at the errors? Plot them over time. A dip after promotions or a shift after a date shows up in a residual plot long before it shows up in a summary.
-
Is the warning in the code or only in the text? A caveat that the model ignores is not a fix.
None of these requires a better model. They require someone to check.
If you want to see what a full solution looks like, the folder also includes a reference notebook. It walks through every step in order, from availability rules and a leakage self-test to residual diagnostics and production monitoring.
The datasets, the prompt, every model’s response and the reference notebook are available in this shared folder.