

In Part I of this series, we started from two forecasting models that had the same MSE to three decimal places and a very different level of risk, and we traced the problem back to the loss function itself: training with MSE is the same as assuming a Gaussian whose width never changes. The fix was a second output head for the variance, trained with the Gaussian negative log-likelihood (NLL). In Part II we found that this fix quietly breaks as soon as you forecast more than one step ahead, because feeding the predicted mean back into the model pretends that every previous prediction was perfect, and we repaired it by feeding back samples instead and running many rollouts.
Both articles left one assumption untouched. A forecaster with a mean head and a variance head can tell you where the next value of the signal will be and how sure it is about that, but whatever it tells you, it tells you in the form of one symmetric bell curve. For a signal that drifts and jitters this is a perfectly reasonable description, whereas for a signal that can jump, or switch, or sit on a threshold and go either way, it is not, and the uncomfortable part is that the model can have exactly the right mean and exactly the right variance and still describe a future that never happens.
So if Part I was about the size of the uncertainty and Part II was about how it travels through time, this part is about its shape. We will move from the simple single bell curve of Part I to a handful of bell curves, from a handful to infinitely many, and from there to a diffusion model, which we will finally plug into the sampled rollout of Part II without changing anything else.
···
Diffusion for time series, not for images
Almost every introduction to diffusion models I’ve read explains them with images, and actually for a good reason, since generating images is what made them famous. This article does not contain a single image of a cat. What our diffusion model generates is one number: the next value of a signal, given its past.
I have to warn you, this is a long article, and deliberately so, because I did not want to skip a single step of the reasoning. You do not need to know anything about diffusion models to follow it. The theory comes first and the data comes last, and every figure can be reproduced with the companion notebook.
Because the article is long, here is a map of it, and I would suggest looking at it for a moment before reading on and coming back to it whenever you feel lost in the details.
Roadmap of the article in nine stops: the problem with a mean and a variance, mixtures of bell curves, infinitely many bell curves, adding noise, removing noise, the training loss, why MSE is enough, drawing samples, and the forecasting experiment. Each stop lists the question it answers and the answer in one line.
···
1. The problem: one situation, many possible futures
1.1 What a probabilistic forecast actually claims
Before we can talk about the shape of a forecast, we should be precise about what a probabilistic forecast is a statement about, because this is the point where the example that follows is most easily misunderstood.
Suppose you could bring a physical system into exactly the same situation a thousand times, with the same history and the same recent readings, and each time let it run for one more step and write down the next value. You would not get the same number a thousand times, because there are always influences that the past readings do not determine, such as thermal noise, turbulence, or simply things the sensor does not see. What you would get is a collection of a thousand numbers. A probabilistic forecast is a description of that collection. When the two-head model of Part I outputs and , it is claiming that those thousand numbers would cluster tightly around , and when it outputs it is claiming that they would be scattered widely. The distribution does not say that several values occur together; it says that we do not know in advance which of them will occur, and it tells us how often each one would turn up if we could repeat the situation.
1.2 A situation that can go two ways
Let’s now consider a system that sits on a threshold. A good picture is a ball balanced on the top of a small hill between two valleys, but you may equally think of a valve that will either open or stay shut, or of a detector that will either keep its lock or lose it. The ball will not stay on the hilltop, since the slightest disturbance makes it roll down, and it will roll either into the left valley, which I place at , or into the right valley, which I place at .
If we repeat this situation a thousand times, then in roughly five hundred of the runs the next value ends up close to , and in the other five hundred it ends up close to , with a small scatter of about around each of the two positions. In no single run is the ball in both valleys, and in practically no run is it still on the hilltop. The collection of outcomes, however, consists of two separate groups, and so its histogram has two narrow bumps with nothing in between.
The forecast does not claim that the ball goes to both valleys; it claims that we cannot know which one, just as with a coin before it is flipped. The honest forecast for a coin is “heads or tails, fifty-fifty”, and a forecast of “half-heads” would make no sense, even though it is the average of the two. In the same way, the honest forecast for the ball is “the next value will be either near or near , and I cannot tell you which, because both are equally likely”.
1.3 What the two-head model reports
Now let’s ask what the best possible Gaussian head would say about this situation. A Gaussian head can only ever answer in one format, “around , give or take “, and when it is trained with the Gaussian NLL, the best answer it can learn is always the same: is the average of the outcomes, and is their typical distance from that average. A perfectly trained Gaussian head model therefore reports “around 0, give or take 1“. Its single bump is centred exactly on the hilltop, which makes 0 its most likely value, while the real ball practically never ends up there.
For the ball, both numbers are easy to work out. Half of the outcomes are near and half near, so the average is 0, right on the hilltop. Every outcome lies about 1 away from 0, so is about 1. (More precisely, , where the comes from the small scatter around each valley, so .)
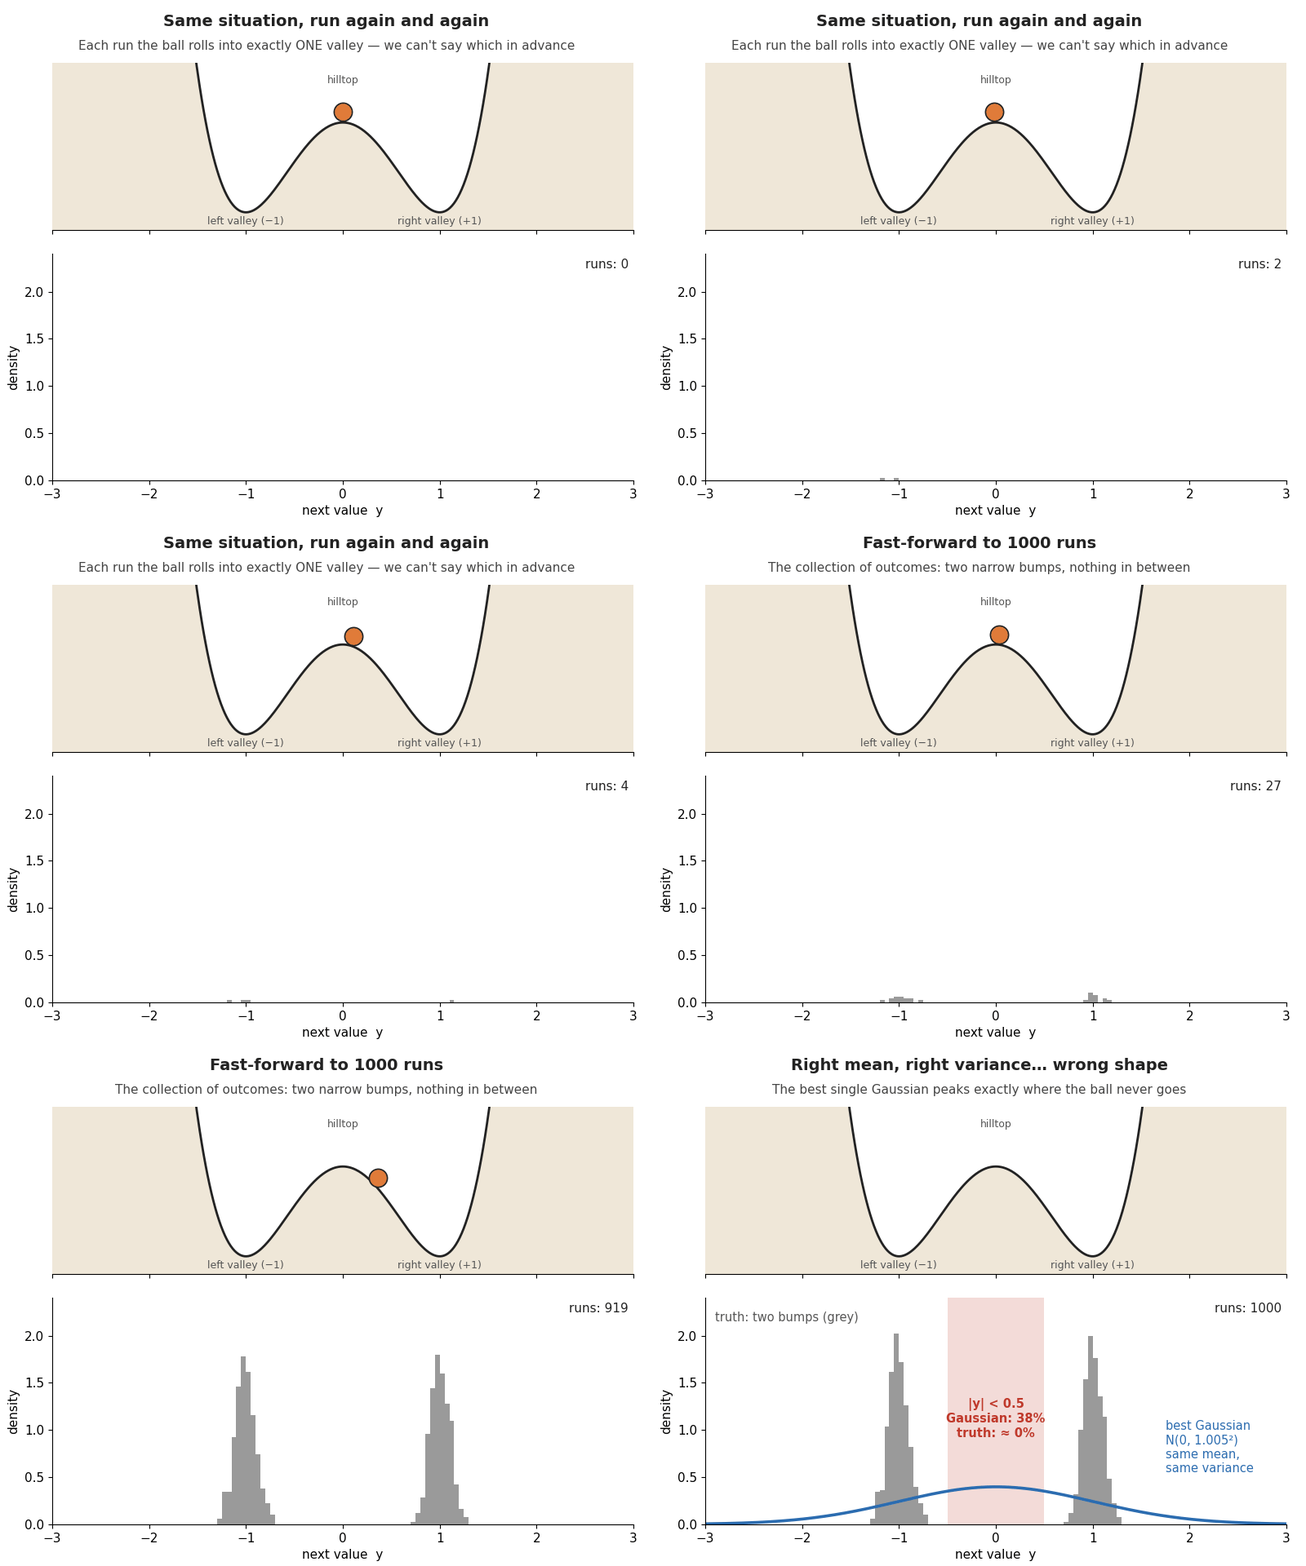
Animated thought experiment for probabilistic forecasting. The same situation is run again and again, and each time the ball rolls into exactly one of two valleys, so the outcomes form two narrow bumps at minus one and plus one. The best single Gaussian has the same mean and variance, yet it peaks on the hilltop and puts about 38% of its probability where the ball never goes.
The mean is correct and the variance is correct, so nothing went wrong during training, and still the forecast is wrong in the only sense that matters, because the value it considers most probable is the one place where the ball will certainly not be. In Part I the two models differed in a number that MSE could not see, namely the variance, and here the forecast and the truth differ in something that even the mean and the variance together cannot see.
1.4 Why this matters even more in a rollout
The damage becomes worse once we remember Part II. If we sample from this Gaussian and feed the samples back into the model, which is exactly what a sampled rollout does, then roughly 38 % () of our simulated futures take their very first step into the region between the valleys, , which the real system practically never visits. The model has never seen such inputs during training, so whatever it predicts next is extrapolation, and a wrong shape at one step has turned into an out-of-distribution input at the next step.
A Gaussian head can get the mean right and the variance right and still get the future wrong!
···
2. First step beyond the bell curve: K bell curves
2.1 The idea
If one bell curve cannot describe two bumps, the most natural repair is to use two bell curves, or more generally of them, and to let the model say how much weight each one should get. This is called a mixture of Gaussians, and a forecaster that outputs its parameters is called a mixture density network. Its forecast for the next value is a weighted sum of bell curves:
Every one of the components has three numbers. The weight says how probable this component is, and the weights are positive and sum to one. The mean says where the component is centred, and the variance says how wide it is. For the ball on the hilltop, components with ,, and reproduce the truth exactly.
2.2 How a mixture produces a sample, and the hidden variable inside it
The way a sample is drawn from a mixture deserves a close look, because it contains the seed of everything that follows. Drawing a sample takes two stages. In the first stage we choose one of the components at random, where component is chosen with probability , and in the second stage we draw a value from the bell curve of the chosen component:
For the ball, this is flip a coin to decide which valley, then add a little scatter. The index is a quantity that the model uses internally and that never appears in the data, since our sensor records the position of the ball and not a label that says which scenario it belongs to. Such a quantity is called a hidden variable (or latent variable), and with it the mixture can be written in a form that we will meet again and again, the probability of each scenario multiplied by a simple bell curve for that scenario:
This formula carries the central lesson of this section: a complicated distribution can be built from simple bell curves, provided that a hidden variable decides which bell curve is used. Each piece is as simple as the Gaussian head of Part I, and all the richness comes from the hidden choice.
2.3 Where a handful of bell curves stops being enough
A mixture has three weaknesses, and they are worth stating clearly because the next section addresses precisely these.
-
The first is that the number has to be chosen in advance and by hand. Two components are right for the ball on the hilltop, but, generally, for a realistic signal you do not know in advance how many components exist.
-
The second is that many shapes are not “a few bumps” at all. A distribution with a long tail on one side, a ridge, or a bump whose position varies continuously can only be approximated by placing a great many narrow components side by side.
-
The third is more subtle and concerns training. Since we never observe which component produced a given data point, the likelihood of that data point has to add up the contributions of all components, which is the sum in the formula above. With or this sum is easy to compute. Keep it in mind, however, because it is about to become the main obstacle.
···
3. Second step: infinitely many bell curves
3.1 From a list of scenarios to a continuum
If the trouble with a mixture is that is a small number we have to choose, the boldest way out is to stop counting. Instead of a hidden index that takes one of values, we use a hidden variable that is a continuous number, and we draw it from the simplest distribution there is, a standard Gaussian. Instead of a list of means , we use a function that assigns a mean to every possible value of . With a finite list we could write down one centre per scenario, but there is no way to list a centre for every real number, so we need a rule that produces one, and that rule is the function . The sum over components then turns into an integral:
It helps to put the two formulas side by side and to see that every ingredient of the mixture has simply been replaced by its continuous counterpart:
|
mixture of bell curve |
continuous mixture |
|
|---|---|---|
|
the hidden variable |
an index |
a number |
|
how likely each scenario is |
the weight |
the density |
|
the centre of each bell curve |
an entry of a list |
a value of a function |
|
how the pieces are combined |
a sum over |
an integral over |
|
number of bell curves |
|
infinitely many |
Drawing a sample works exactly as before, in two stages, where we first draw the hidden variable and then draw from the bell curve it selects:
3.2 An example you can compute by hand
To see how much freedom this gives, take the function and a small width . The function is an S-shaped curve that is close to for negative inputs and close to for positive inputs, and the factor 8 makes the transition between the two very steep. Three values of show what happens: receives the centre , receives the centre , and only a value very close to zero, such as , receives a centre in between (). A standard Gaussian is negative half of the time and positive half of the time and is rarely that close to zero, so about half of the samples land near and the other half near .
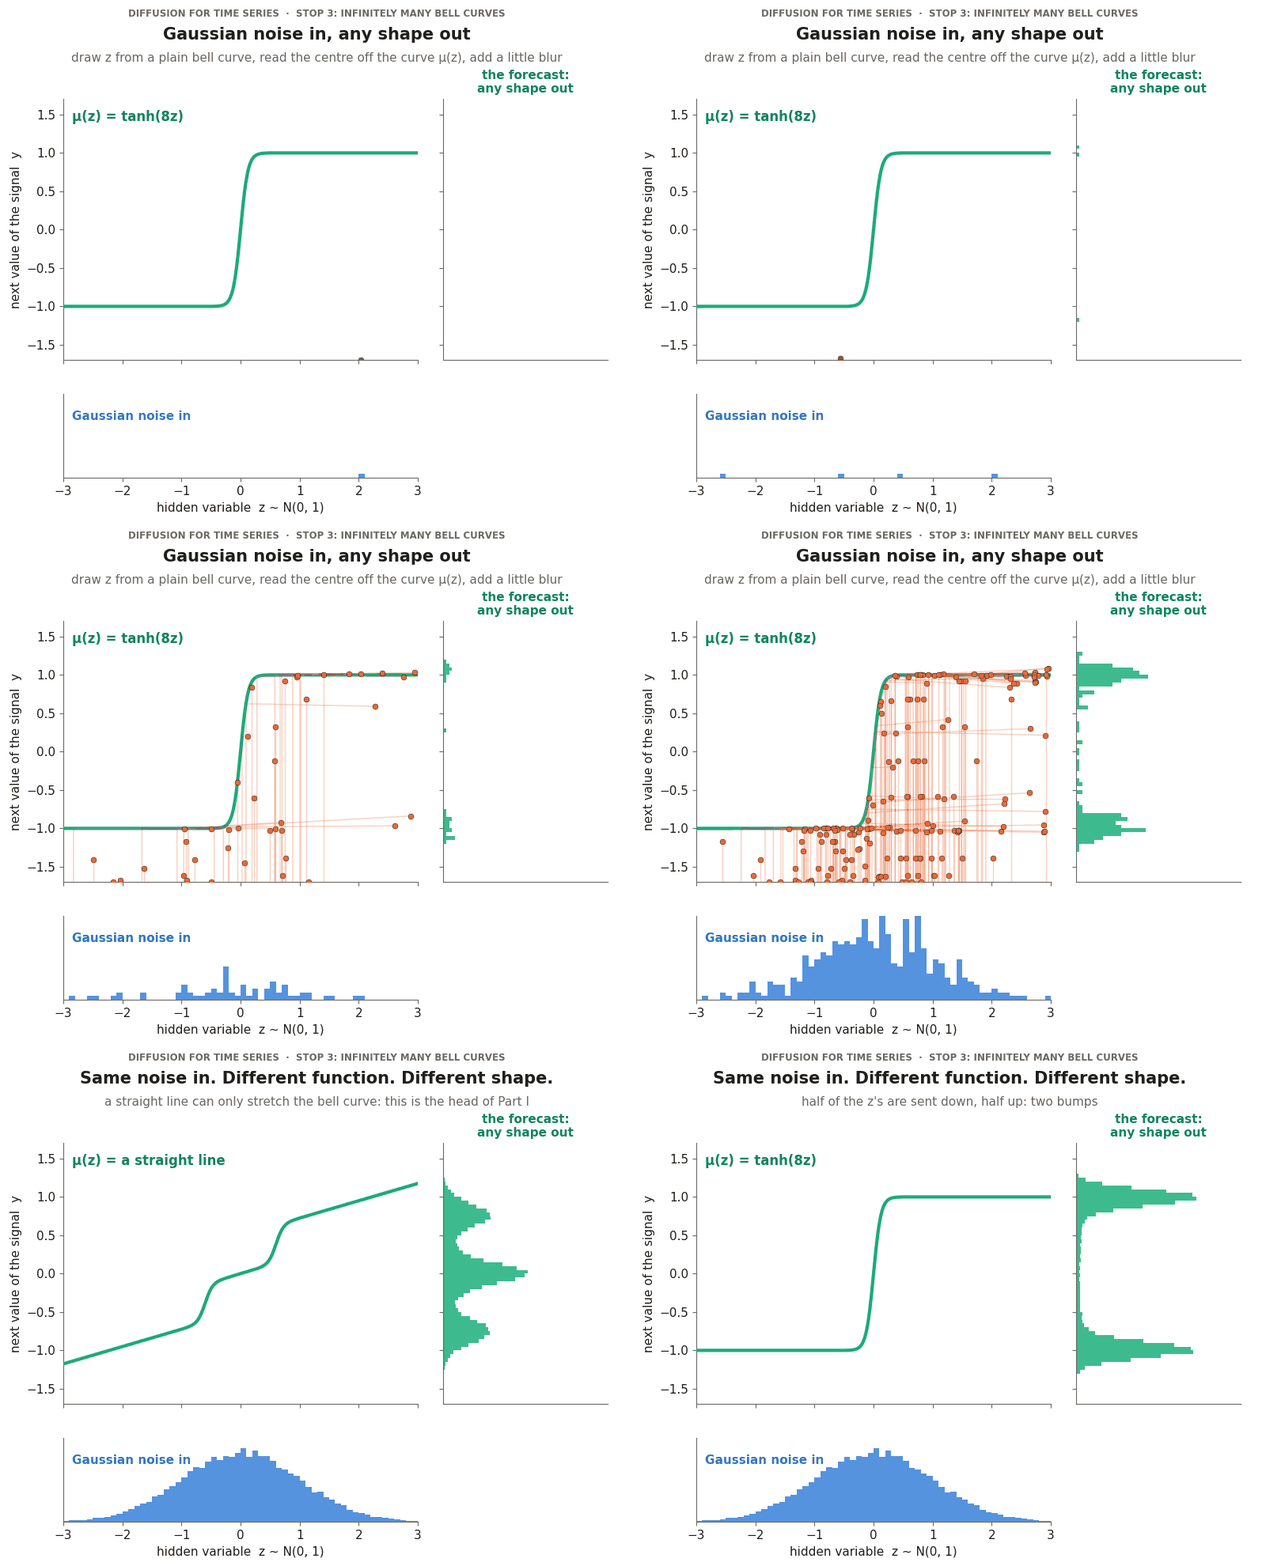
Animated demonstration of a continuous mixture. Values drawn from a standard Gaussian are mapped through a function and blurred slightly, and the output histogram builds up on the right. When the function changes, the forecast distribution changes with it: a straight line gives a bell curve, an S-curve gives two bumps, a staircase gives three bumps, and an exponential gives a long tail.
If is a neural network with learnable weights, a model of this kind can in principle express any shape whatsoever, without anybody having to choose a number of components. This is the principle behind essentially all modern generative models, and it is the idea we will keep: Gaussian noise in, a learned nonlinear function, any shape out.
3.3 The price: the likelihood can no longer be computed
So far we have only seen how such a model generates samples once the function is given. The hard part is to learn from data, and the way we have trained every model in this series is maximum likelihood, which means adjusting the weights so that the observed data becomes as probable as possible under the model. For that we need the probability of an observed value , which is the integral above.
With a mixture of components, the corresponding quantity was a sum of terms, and we could simply compute it. Here the sum has become an integral over all possible values of the hidden variable, with a neural network inside it. Such an integral has no closed form, which means that there is no formula we could write down and evaluate exactly.
The model is powerful enough, but in this form it is very hard to train. (Variational autoencoders train exactly this kind of model by learning a second network that guesses from ; diffusion models take a different route, which is the subject of the rest of this article.)
3.4 The way out: build the hidden variables ourselves
Diffusion models resolve this difficulty with two ideas that are both simple, and that I would like you to carry through the rest of the article.
The first idea is to stop treating the hidden variable as a mystery. In the continuous mixture, the hidden variable was an abstract number whose relation to the data had to be discovered. A diffusion model instead constructs its hidden variables directly from the data, by a fixed and fully known recipe: it takes the data value and adds noise to it. The hidden variable is then nothing more than a noisy copy of the data, and for every training example we know exactly which hidden variables belong to it, because we made them ourselves.
The second idea is to replace one large leap by many small steps. In the continuous mixture, a single function had to turn pure noise into data in one go, deciding everything at once. A diffusion model instead adds noise gradually, creating a chain of copies that range from almost clean to pure noise, and learns to walk back one small step at a time. Think of a film of ink spreading in water: guessing the first frame from the last one is hopeless, but guessing frame 99 from frame 100 is easy, because the two frames are almost identical. Each small step back is so simple that one bell curve describes it well, which is exactly what the Gaussian head of Part I can do. And because we made the noisy copies ourselves (the first idea), we always know which copy belongs to which data point, so every step can be trained directly.
Together they give us two paired processes. The forward process adds noise to a clean value step by step until only noise is left, and involves no learning at all (Section 4). The reverse process is a neural network that removes a little noise at each step (Section 5), and we will have to work out what it should be trained to do (Sections 6 and 7) and how it produces a forecast value (Section 8).
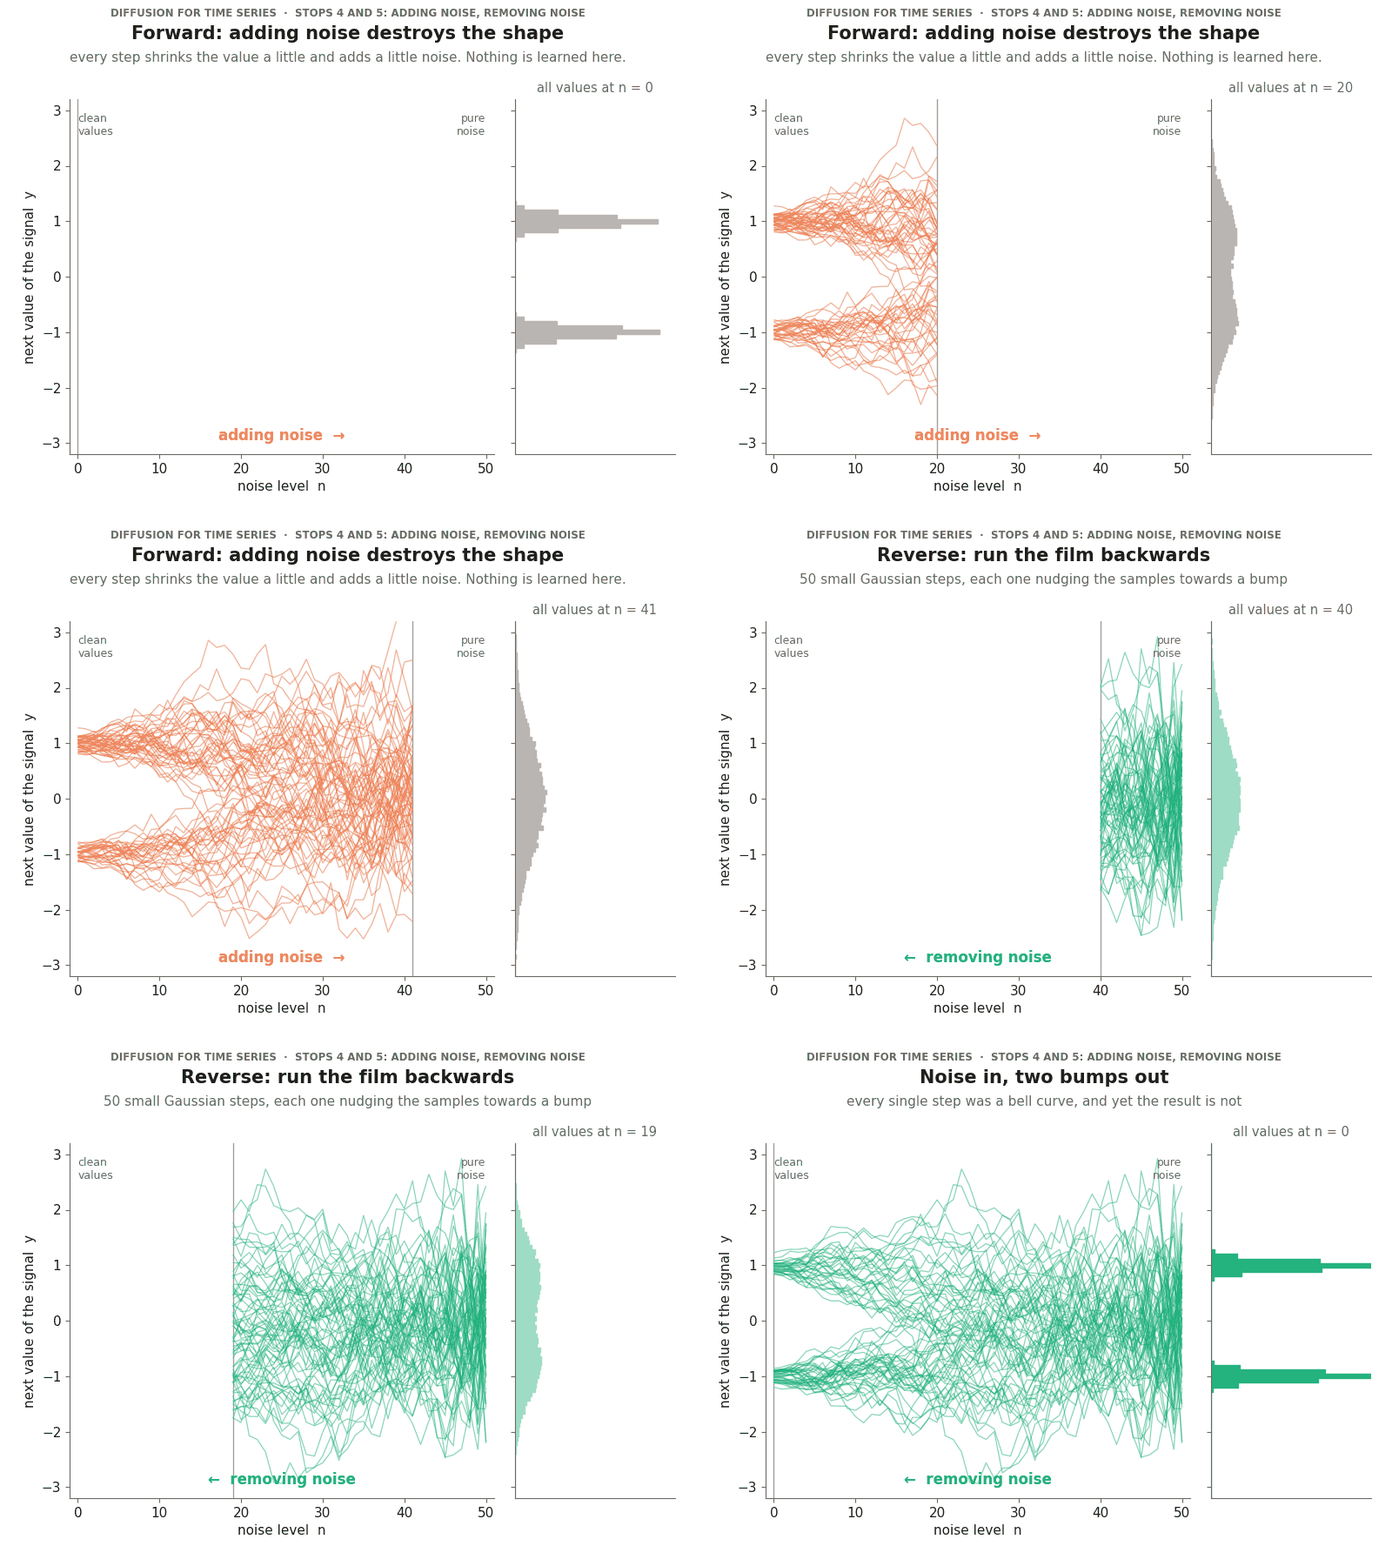
Animated view of both diffusion processes. Going forward, adding noise step by step melts the two-bump distribution into a plain bell curve. Going in reverse, fifty small Gaussian steps turn the bell curve back into two bumps. The reverse steps use the exact best guess of the clean value, with no neural network involved.
3.5 A word on notation
From here on there are two different kinds of “time” in play, and keeping them apart avoids most of the confusion around diffusion models for time series. In this series, has always been the time index of the signal and the context length, so I will keep those and use the letter for the noise level. Most diffusion papers call the noise level and the number of levels , which you should keep in mind if you read them alongside this article.
Two remarks will keep the next sections light. Since we forecast one reading at a time, the quantity being noised and denoised is a single number, the next value of the signal (for vectors, such as images, every formula holds in the same form for each component). And everything in Sections 4 to 8 happens for a given context: the forecast distribution is always the distribution of the next value given the past, but I leave the context out of the formulas until Section 9, where it comes back as an extra input of the network.
···
4. The forward process: adding noise
Goal of this section. We want a recipe that gradually turns a clean value (during training) into pure Gaussian noise over steps, and we want to understand every symbol in it.
4.1 Two things to know about Gaussians
A Gaussian distribution describes a random number that is probably close to its mean , with a spread that is controlled by its variance . The noise we will add is a draw from the standard Gaussian, , which has mean 0 and variance 1. There is a convenient way to draw from any Gaussian using only standard noise, which is to draw and then shift and scale it:
This is called reparameterisation, and it is exactly how the Gaussian head of Part I draws a sample. It looks like a small trick, but it is the engine of everything in this section, because it lets us write every noising step as an ordinary equation instead of as a probability distribution. The notation that appears below simply means “the density of a Gaussian with mean and variance , evaluated at “.
4.2 One small step
We start with a clean value and define a noise schedule , a list of small numbers that control how much noise is added at each step. At every step we take the value from the previous step, shrink it a little and add a little Gaussian noise. Written as a probability distribution, the rule is
and in reparameterised form, which is the form we actually use in code,
The letter is used for this fixed forward process, and we will use later for the learned model. Let’s dissect each piece.
What is ? It is a small number between 0 and 1, and you can think of it as a dial: means that no noise is added at this step, and means that the value is thrown away completely and replaced by noise. In the original paper on these models, grows linearly from to over steps, so every individual step changes the value only slightly.
4.3 Why , and not simply ?
This is a design choice, but it is a principled one, and seeing where it comes from takes only one goal and two basic facts about random numbers.
The goal: keep the variance equal to 1 at every step. Generation will start from a standard Gaussian, , so the forward process must end exactly there, because otherwise the network would be trained on one kind of input and used on another. The simplest way to guarantee this is to standardise the data to variance 1 and to keep the variance at 1 at every single step, which also keeps the inputs of the network on the same scale at every noise level.
-
Rule 1: scaling a random number squares the factor in its variance. If has variance and we multiply it by a constant , then . If you stretch a distribution by a factor of 2, its standard deviation doubles and its variance becomes four times as large, because variance is measured in squared units.
-
Rule 2: the variances of independent random numbers add up. If and are independent, then , with no cross term, because independent quantities do not vary together.
Building the formula from the goal. Let’s mix the previous value with fresh noise using two unknown constants and ,
and compute the variance of the result. Since and are independent, Rule 2 lets us add the variances of the two terms, and Rule 1 tells us how the constants enter:
Variance preservation therefore requires . The noise schedule decides which share of this variance budget is handed to the fresh noise at step , namely , and the rest must go to the old value, . Taking square roots gives
so the square roots are not arbitrary at all, since they are the only positive solution of once has fixed the share of the noise.
Verifying that it works. Plugging back in, . At every step the signal shrinks a little (it is scaled by ) while noise fills the gap (it is added with scale ), and the total variance stays perfectly balanced.
What goes wrong without the square roots? Suppose we had naively used . The variance would then follow the rule . With and a starting variance of 1, the first step gives , and if we keep applying the rule the variance continues to fall until it settles at the value where it no longer changes, , which is . The chain would end at a narrow Gaussian with variance and not at the standard Gaussian with which generation starts. Suppose instead we had used , adding noise without scaling the old value down. Then the variance would grow by at every step, and, worse, the clean value would never be forgotten, because its coefficient would stay equal to 1 forever and the chain would never arrive at pure noise.
4.4 The jump formula: from the clean value to any noise level in one shot
Training will require noisy versions of our data at many different noise levels, millions of times. If we had to walk through all the individual steps each time, training would be hopelessly slow, so we need a shortcut, a direct formula that jumps from the clean value to any noise level in one go. The idea behind it is that many small independent Gaussian noises add up to one bigger Gaussian noise.
Step 0: the Gaussian addition rule. Before doing any algebra, we need one fact that will do all the heavy lifting. If and are independent, then
The variance part is Rule 2 from above. The additional statement, that the sum of two independent Gaussians is again a Gaussian, is a standard result of probability theory. Together they say that two independent Gaussian noises can always be replaced by a single Gaussian noise whose variance is the sum of the two variances.
Step 1: shorter notation. Let , so that the one-step rule becomes
Step 2: expanding two steps. Let’s write out two consecutive steps to see the pattern. The first step goes from to :
The second step goes from to , and we substitute the expression for :
We now have one clean signal term and two separate noise terms, and the next step is to merge the latter.
Step 3: merging the two noise terms. This is where the addition rule of Step 0 does its work. The noisesandare independent standard Gaussians, so by Rule 1 the two scaled noise terms are Gaussians with variances and , and by the addition rule their sum is a single Gaussian whose variance is
The two noise terms therefore collapse into one,
where the equality means that both sides have the same distribution, and substituting back gives
Step 4: the general formula. The pattern is now visible, and the same arithmetic extends to any number of steps: the signal is multiplied by the square root of the product of all the ‘s, and the combined noise has variance one minus that product. If we define the running product
then for any noise level all the intermediate noise terms collapse into a single one, and we obtain the jump formula:
Written as a probability distribution, this says the same thing:
You can read it as a recipe, which says that we keep a fraction of the clean value and add noise with standard deviation. Note that thein this formula is the total noise accumulated since , and not the noise of step alone.
The payoff. We never have to loop through the noising steps during training. We pick a noise level, draw a single , and compute from in one line, which is what makes training a diffusion model computationally feasible.
4.5 The noise schedule
We still have to choose the numbers , and it is worth understanding first why the choice matters at all. The jump formula depends on the schedule only through , the share of the signal that survives after steps, so choosing a schedule means choosing how this share falls from 1 (clean data at ) to practically 0 (pure noise at ).
The schedule decides how our fixed number of steps is spent. If the signal disappears too slowly, the chain never reaches pure noise, and generation would then start from inputs the network has never seen. If it disappears too quickly, most of the steps are wasted on turning noise into more noise, while the interesting part, where the bumps merge, is squeezed into a few large steps, and large steps are exactly what the reverse process cannot handle (Section 5). A good schedule lets the signal fade at a steady pace, so that every step does a similar, small amount of work.
One option is to choose the directly, such as the linear schedule from to mentioned above. The other option is to design the curve itself, as a smooth descent from 1 to 0, which guarantees an even pace for any number of steps, and to derive the individual steps from it. Since by the definition of the running product, we have
A popular curve of this kind is the cosine schedule,
in which the division by makes sure that exactly, the cosine reaches zero at so that no signal is left at the end, and the small offset keeps the very first steps from being vanishingly small.
The linear schedule, run over only 50 steps, still leaves 60 % of the signal at the end, so it fails the too slow test, and even with 1,000 steps it is rather fast, since about a third of its steps happen when less than 1 % of the signal is left. The cosine curve falls gently and evenly, which is why it was proposed and why the companion notebook uses it with steps. With so few steps, the first steps are small ( below) but the last few are not (about , and ), which does little harm in practice because at that point almost no signal is left anyway, and which you can cure by increasing at the price of slower sampling.
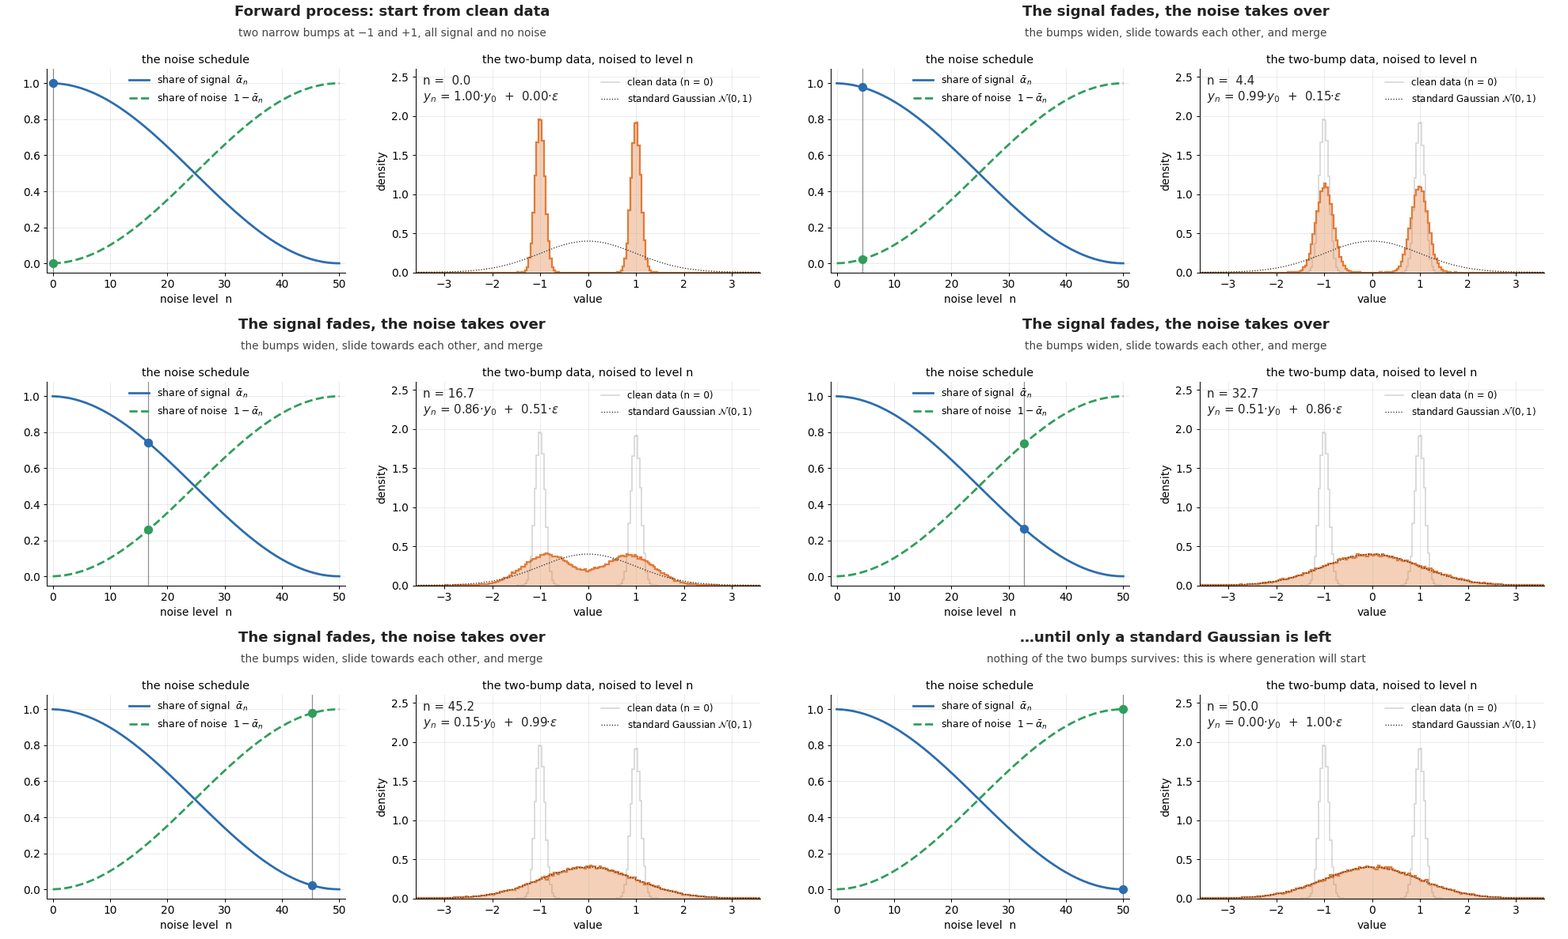
Animated diffusion forward process: a cosine noise schedule shrinks the signal and adds noise step by step, turning a two-peaked distribution into a standard Gaussian.
···
5. The reverse process: removing noise
5.1 One big leap is hard, one small step is easy
Suppose somebody hands you pure noise and asks what the clean value was. Pure noise carries no information about the data, so the honest answer is anything the data could be, which is the full two-bump distribution, and describing that with one Gaussian brings us straight back to Section 1. This is also the single large leap that the continuous mixture of Section 3 had to perform.
Now suppose instead that you are handed and asked only what was, one step earlier. The one-step rule tells us that is plus a small amount of noise, so must have been close to , give or take about . The answer lives in a small window, and inside a small window a distribution cannot do anything dramatic, since it cannot contain two bumps that are far apart, which is why a single Gaussian describes it well. For the two-bump data, the distribution of “where was this value steps earlier” can be computed exactly, and Figure 6 shows how it changes as we look further and further back.
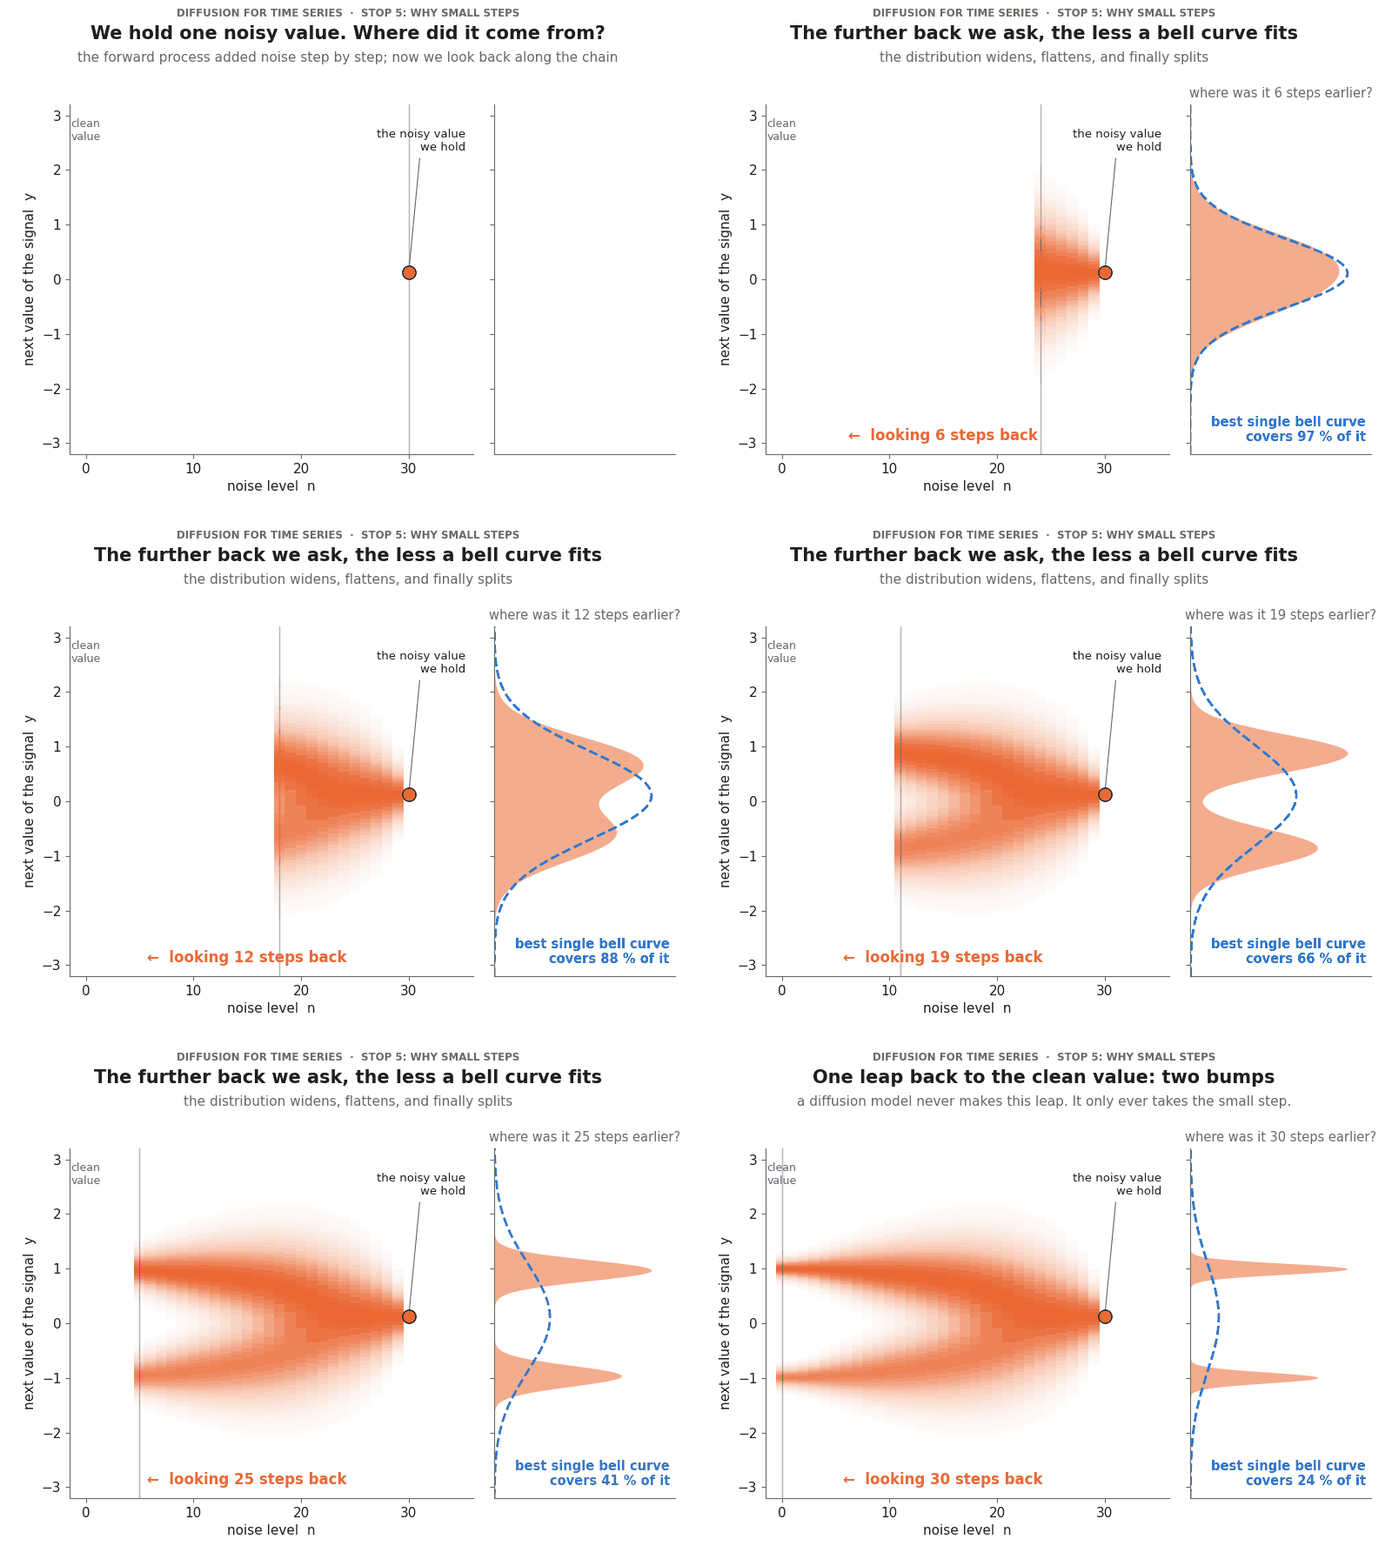
Animated explanation of why diffusion models use many small steps. Starting from one noisy value at noise level 30, the animation shows where that value was one step earlier, two steps earlier, and so on. One step back the answer is a narrow bell curve that a single Gaussian covers almost completely; thirty steps back it has split into two bumps, of which a single Gaussian covers less than a quarter.
This is the key observation of the whole method: when each forward step adds only a little noise, each reverse step is approximately Gaussian, even though the distribution of the data is not.
5.2 Each reverse step is a Gaussian head
We therefore model every reverse step as a Gaussian whose mean is predicted by a neural network:
If this looks familiar, it should, because it is the two-head model of Part I with two small changes:
-
The variance is fixed, not learned. The network only predicts the mean; the width of each step is set by the noise schedule.
-
It is used times in a row, not once. Each call removes a little noise, taking the noisy value and the noise level as extra inputs alongside the context.
A single network serves all the steps, and it is told at which noise level it is working, so that it can behave differently when it is removing heavy noise and when it is polishing the last details.
5.3 Where does the shape come from?
Since every single step is Gaussian, you may wonder where the non-Gaussian shape comes from, and there are two ways of seeing it that tie this section to the earlier ones.
The first way is to look at the last step of the chain. The final value is drawn from a bell curve whose centre depends on the previous value , and is itself random, so the distribution of is
If you compare this with the continuous mixture (Section 3), you will see that it is the same formula, with the noisy value in the role of the hidden variable . A diffusion model is an infinite mixture of bell curves, and in fact a whole tower of them, because the distribution of is in turn an infinite mixture over , and so on up to pure noise.
The second way is to look at the chain as a whole. Each step moves the sample by a small amount in a direction chosen by a nonlinear function . We have in fact already seen this mechanism at work in Part II without calling it by this name: a sampled rollout is also a chain of Gaussian steps in which each step depends on the previous sample, which is why the distribution of a rollout after sixteen steps is not a Gaussian even though every individual step is one. Part II composed Gaussian steps along the time axis of the signal, and a diffusion model composes them along a second, artificial axis, the noise level, so that even one single time step can have any shape.
···
6. Training: what should the network learn?
Goal of this section. We want to train a model that, given a noisy value and its noise level , predicts the noise that was added to the clean value .
Step 1: why can’t we just invert the forward process?
The jump formula told us how to go from a clean value to a noisy one in one shot:
Naively, one might think that this is all we need, since we can simply rearrange it for :
The problem is that is gone. When we ran the forward process we drew at random and mixed it into , and at generation time that particular is not available to us. In terms of the equation, we have one equation with two unknowns, and , and infinitely many pairs of a clean value and a noise could have produced the noisy value we are holding. (During training the situation is different, since there we chose and drew ourselves and therefore know both.)
This is exactly why we need a neural network: to estimate from the noisy value alone. If we can make a good guess of what was, the rearranged formula gives us a guess of .
The derivation that follows is the hardest part of the article, so here is its destination and its main moves before the first equation. (1) We cannot compute how probable the data is under the model, because that would require every possible path of noisy values. (2) So we score the model only on paths that we generate ourselves, which gives a lower bound on that probability. (3) This score splits into one comparison per noise level, between the step of the network and an ideal step that knows the clean value. (4) Both steps are bell curves of the same width, so each comparison is a squared error, and after a change of variables it is a squared error on the noise.
Step 2: what should the network actually optimise?
The goal. As everywhere in this series, we want the model to give a high probability to the data we actually observed, so we want to maximise , averaged over the dataset. (We use logarithms because they turn products into sums and because they penalise near-zero probabilities heavily: if the model assigns a probability of to something that really happened, then .)
The problem. The model never produces directly. It walks a path, from pure noise through to, and what it defines directly is the probability of a complete path, which is the product of the probabilities of its steps:
In words, this is the probability of starting from this particular noise (which is just a standard Gaussian) multiplied by the probability of each denoising step. To obtain the probability of alone, we would have to add up every path that ends there:
Think of a city map. “How likely is this one route?” is an easy question, since you multiply the probabilities of each turn, whereas “how likely am I to end up at this address, by any route?” means summing over all routes. With steps, even a crude grid of 100 values per step would need evaluations of the network!
The solution: score only the paths we make ourselves. We bring in our own forward process, , where is shorthand for all the noisy values together. We know this process exactly, we can sample from it as often as we like, and its paths are precisely the ones that belong to this particular . Four short moves then give a quantity we can compute.
(a) Multiply by 1. We multiply and divide by , which changes nothing:
(b) Recognise an average. An integral in which something is weighted by a distribution is an average over samples from :
(c) Take the logarithm of both sides, since the log-likelihood is what we are after.
(d) Move the logarithm inside the average (Jensen’s inequality). The logarithm bends downwards, so the logarithm of an average is always at least as large as the average of the logarithms. For the two numbers 1 and 100, for example, the logarithm of their average is , whereas the average of their logarithms is . Hence
The right-hand side is called the evidence lower bound (“evidence” is another name for the probability of the data). Unlike the left-hand side, it can be computed: we generate noise paths ourselves and evaluate two things we know, (how we add noise) and (how the network removes it). And because it is a floor under the log-likelihood, pushing the floor up during training pushes the real thing up with it.
Step 3: how does the ELBO become MSE?
A. One comparison per noise level. The ratio inside the ELBO is a product of backward steps (the model) divided by a product of forward steps (the noising). To compare them step by step, we turn every forward step around with Bayes’ theorem, so that it points backwards too. We are allowed to condition everything on while doing so, because a forward step depends only on the value right before it and not on . With only two steps you can see the whole trick at once:
The factor cancels, and every remaining factor points backwards, just like the model. For more steps the same cancellation happens all along the chain. The logarithm then turns the products into sums, and what is left is
The symbol stands for the Kullback-Leibler divergence, which measures how different two distributions are: it is zero when they agree and positive otherwise. Each term compares two answers to the same question, “where was the value one step earlier?”. The first answer, , is the ideal reverse step, and I will call it the cheat sheet, because it is the answer of somebody who knows the clean value , and we can compute it exactly because we designed the noise ourselves. The second answer is that of the network, which sees only . Of the two end terms, the last-step term turns out to have the same form as the others, and the term without learnable weights compares the end of the forward chain with pure noise and can be ignored.
Training means making the answer of the network agree with the cheat sheet, at every noise level.
B. The cheat sheet is a bell curve. Two witnesses speak about the unknown . The noisy value says that it was near , since is plus a little noise. The clean value says that it was near , by the jump formula. Each of these statements is a bell curve over , and multiplying two bell curves gives a bell curve again, whose centre is a weighted average of the two centres, with the more reliable witness counting more:
The weights and and the variance are fixed numbers that are determined by the schedule. Their exact values do not matter for what follows, and they are listed at the end of this section. If one witness is much more certain than the other, the combined centre sits close to it, and the combined bell curve is narrower than either, because two pieces of evidence together say more than either alone.
C. Equal widths turn the KL divergence into a squared error. We make the step of the network a bell curve with the same width and the same form as the cheat sheet, except that the network has to supply its own guess of the clean value, which it cannot see:
For two bell curves of equal width, the KL divergence is simply the squared distance between their centres, divided by twice the variance. The parts are identical in both centres and cancel, so that
Readers of Part I will recognise this moment, because it is the central statement of that article in a new place: under a Gaussian with a fixed width, maximum likelihood is a squared error.
D. Clean value or noise: the same thing. By the jump formula, knowing and the noise is the same as knowing . So if the network predicts the noise instead, with its guess written , or for short, its guess of the clean value follows from the same formula, and the two errors differ only by a known factor:
Every term of the ELBO is therefore a weight, which depends only on the noise level, multiplied by . Picking the noise level at random then replaces the sum over by an average, and the training loss is
That is plain MSE. (Strictly speaking, once the weights are dropped it is no longer exactly the ELBO but a re-weighted version of it.)
Step 4: the training loop, putting it all together
Now that we have the loss function, training is straightforward, and one training step consists of the following eight actions:
1. Sample a clean value from the dataset (in forecasting: a reading together with the context that preceded it).
2. Sample a random noise level uniformly from .
3. Sample a random noise .
4. Compute the noisy value in one shot with the jump formula: .
5. Forward pass: feed into the neural network. The noise level is turned into a vector by an embedding, so that the network knows how noisy its current input is. For images the network is typically a large U-Net, whereas for our single number a small multilayer perceptron is enough, and in the forecasting setting of Section 9 the network additionally receives a summary of the context.
6. Network output: the predicted noise .
7. Compute the loss: .
8. Backpropagate and update the weights of the network.
This is repeated for many mini-batches, and the network gradually learns to denoise at every noise level. Notice that no chain is run during training and that there is no sampling loop, since every training step is one ordinary forward pass followed by one ordinary backward pass. Figure 7 shows this loop at work on the two-bump data.
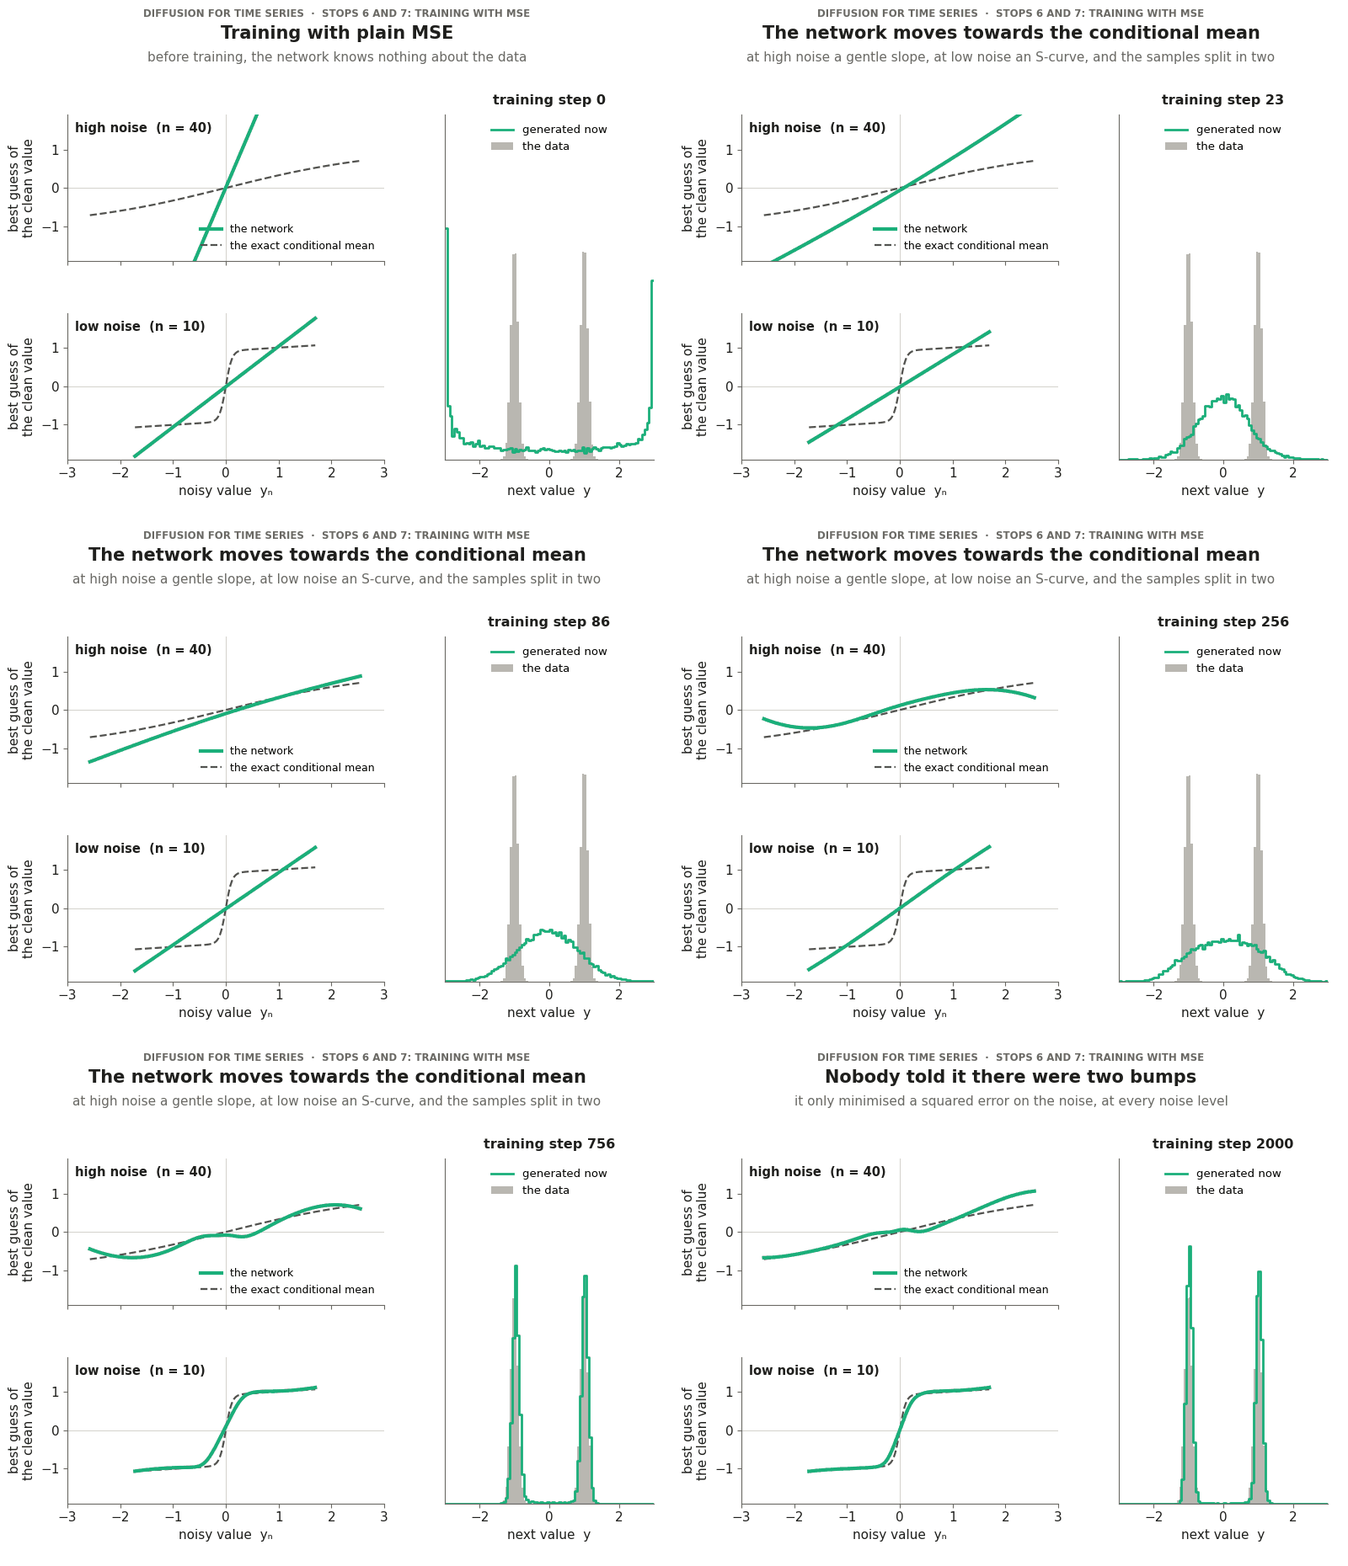
Animated training run of a small denoising network on two-bump data. Left: the network’s best guess of the clean value at a high and at a low noise level, next to the exact conditional mean shown dashed. Right: the samples the network generates at that moment. After 2,000 training steps with a mean squared error loss on the noise, the guesses match the exact curves and the samples form two bumps.
···
7. Wait, MSE again? Wasn’t that the liar?
We have arrived at a strange place. This series began by showing that MSE only learns the conditional mean and therefore cannot express uncertainty, and now we are training a model with MSE and claiming that it captures not only the uncertainty but its entire shape. Both statements are true, and reconciling them is the bridge between this article and the first one.
7.1 What MSE learns, here as everywhere
If you predict a random quantity with a single number and you are penalised by , the best you can do is , and with inputs the same holds for every input separately, so a network trained with MSE learns the conditional mean. Nothing about this has changed in the meantime, because our denoising network is trained with MSE to predict the noise from the pair , and the best it can possibly learn is the conditional mean of the noise, which through the jump formula is the same as learning the conditional mean of the clean value:
The dashed curves of Figure 7 are exactly this quantity. The diffusion network is therefore still a conditional-mean predictor, exactly like the MSE model of Part I. What has changed is the question it is asked. The model of Part I was asked one question, namely what the future is on average.
The diffusion network is asked a whole family of questions, one for every noise level and every possible noisy value: “if the clean value had been noised this much and now looked like this, what was it on average?” A single mean does not determine a distribution, but the whole family of means across all noise levels does. Strictly, this holds in the limit of infinitely many, infinitely small steps; with a finite number of steps the shape is reproduced only approximately, and the approximation improves as the steps get smaller.
7.2 Two cases we can compute by hand
The two-bump example lets us see this with formulas. Suppose first that the clean value really is Gaussian,. Then the best guess of the clean value is
which is a straight line in the noisy value , and the intercept and the slope of that line are completely fixed by and , the two numbers that the heads of Part I output. Suppose now that the clean value is or with equal probability, as for the ball on the hilltop. Given a noisy value , Bayes’ theorem tells us how probable each of the two origins is, and the average of the two origins weighted by those probabilities works out to
which is an S-shaped curve, the same kind of curve that built the continuous mixture in Section 3. At high noise levels, where is close to zero, this curve is flat at zero, so whatever the input, the best guess is the overall average of the data, and this is precisely the Part I answer, the mean that lands on the hilltop where the data never is. As the noise level decreases the curve becomes steeper, and at low noise it is almost a step that sends anything slightly positive to and anything slightly negative to .
7.3 Diffusion without a neural network
Since both best guesses are known in closed form, we can do something instructive and run the reverse process without any neural network, simply by plugging the formulas in. Figure 8 does this for two distributions that have the same mean and the same variance.
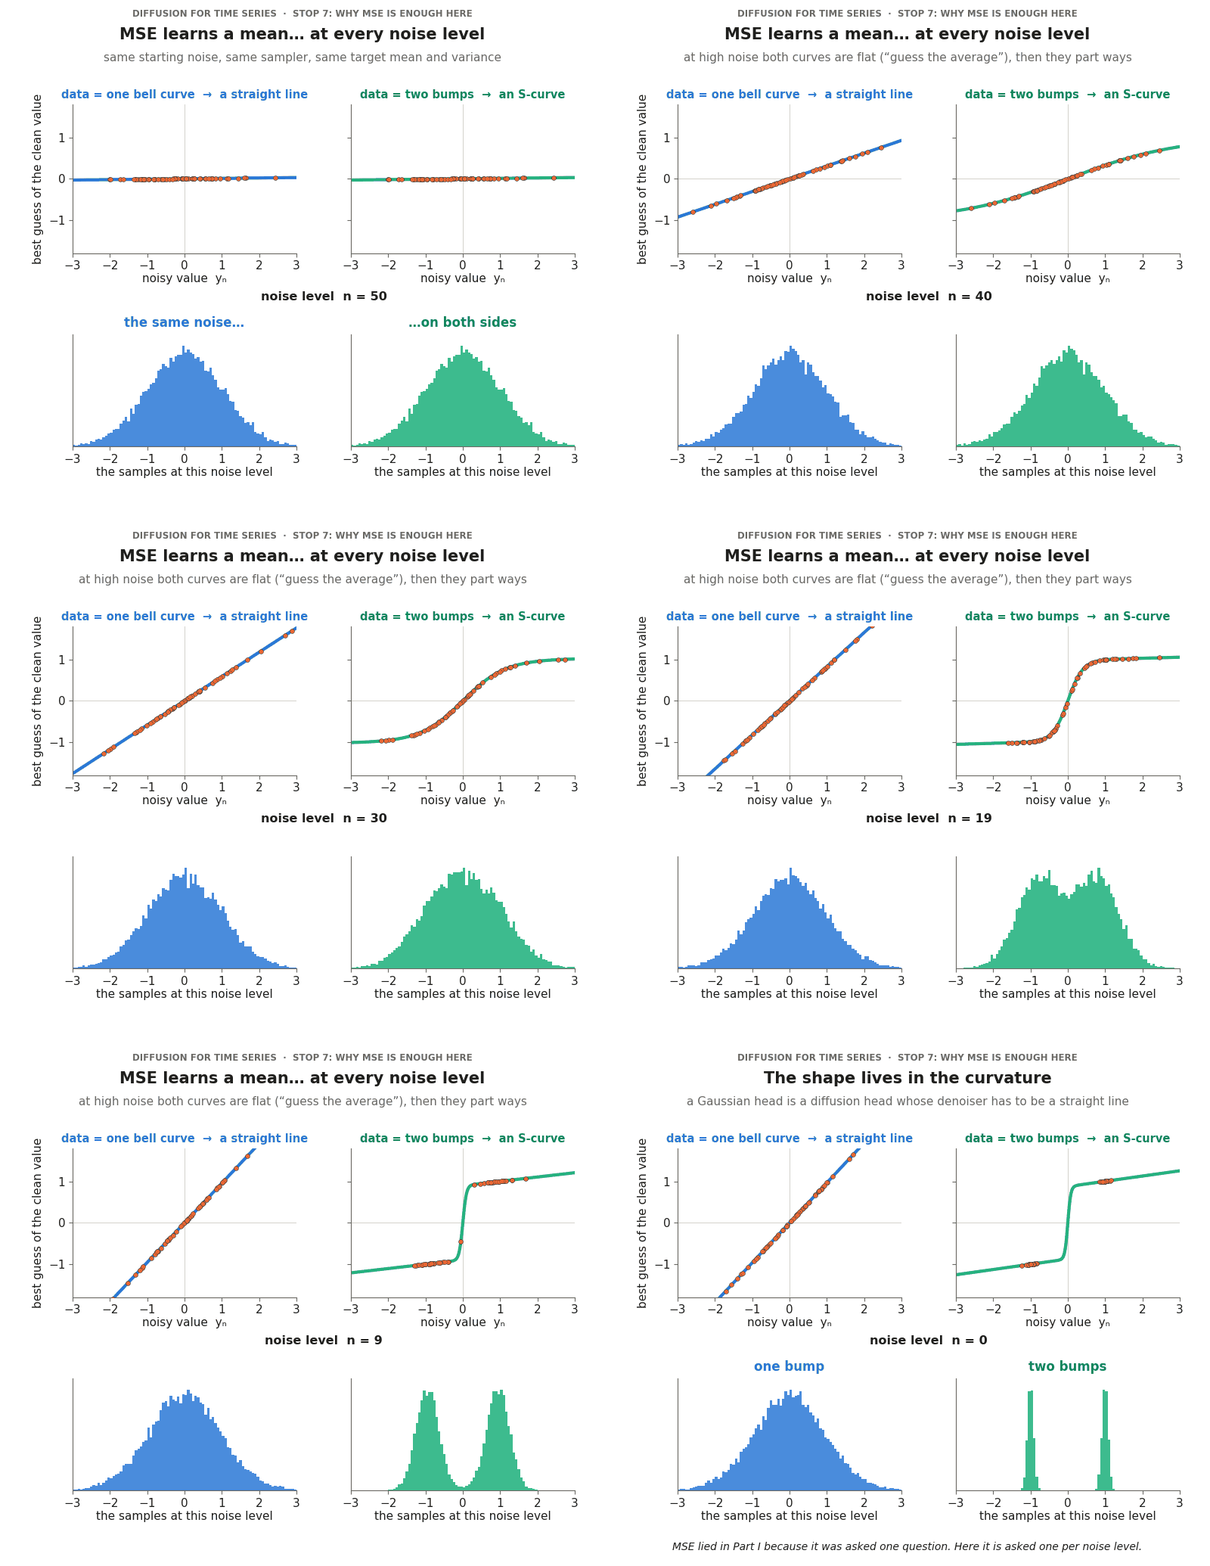
Animated comparison of two reverse diffusion processes that share the same starting noise, sampler and schedule. On the left the denoiser is the straight line that belongs to Gaussian data and produces one bump. On the right it is the S-curve that belongs to two-bump data and produces two bumps. It shows that a Gaussian head is a diffusion head whose denoiser is restricted to a straight line.
Both runs aim at distributions with the same mean and (up to a small error that comes from using only fifty steps) the same variance. The only difference is whether the denoiser is a straight line or a curve, and that difference alone decides whether we end up with one bump or with two. This gives us a precise way of stating the connection between the two kinds of head:
-
A Gaussian head is a diffusion head whose denoiser is restricted to be a straight line. Everything a diffusion head can do beyond a Gaussian head lives in the curvature of what it learns.
-
MSE lied in Part I because it was asked a single question. In a diffusion model it is asked one question for every noise level, and together the answers describe the whole distribution.
7.4 Do more steps make the model more accurate?
Partly, and it is worth separating two sources of error. The first is the size of the steps: each reverse step is modelled as one bell curve, which is exact only for infinitely small steps, so this error shrinks when grows, even with a perfect network. The second is the network itself, which has to learn the conditional mean accurately at every noise level; more steps do not improve this, and small errors of the network accumulate along the chain. The first error can be measured in isolation with the no-network setup of the previous section, where the denoiser is exact.
···
8. Generating a forecast value: running the film backwards
Once the network is trained, drawing one sample works as follows. We start from pure noise, , and then repeat four small operations for .
First, we ask the network for the noise it believes is contained in the current value, . Second, we turn that into a guess of the clean value with the rearranged jump formula (Section 6, Step 1):
Third, we compute the centre of the reverse step with the formula of the cheat sheet, using our guess in place of the unknown clean value, exactly as in Section 6, Step 3:
And fourth, we take the step by adding a little fresh noise, with , except at the very last step, where we want the clean result and add nothing.
Notice that the fourth operation is exactly the line mu + sigma * randn with which the Gaussian head of Part I draws a sample.
Before attaching this to a forecaster, the notebook trains the smallest possible diffusion model, one that generates a single number with no context at all, on the two-bump data of Section 1. It takes a few seconds, and it is a good moment to convince yourself that the machinery of the last four sections works before anything else is added.
···
9. The experiment: a signal that really branches
9.1 The data
We need a signal on which the problem of Section 1 actually occurs, and ideally one for which we know the true answer, so that every model can be checked against it. I will use the ball from Section 1, now as a proper simulation that produces a time series.
The ball rolls in a landscape with two wells, one at and one at , separated by a small hill at , which I will call the barrier. A force pushes the ball downhill towards the nearest well, and on top of this it receives small random kicks, which you can think of as thermal noise or turbulence. Most kicks only make it jiggle inside its well, but once in a while a lucky series of kicks carries it over the barrier into the other one. Our sensor records only one reading every hundred simulation steps, so a complete jump can happen between two consecutive readings. The equations of the landscape and of the simulation are in the notebook.
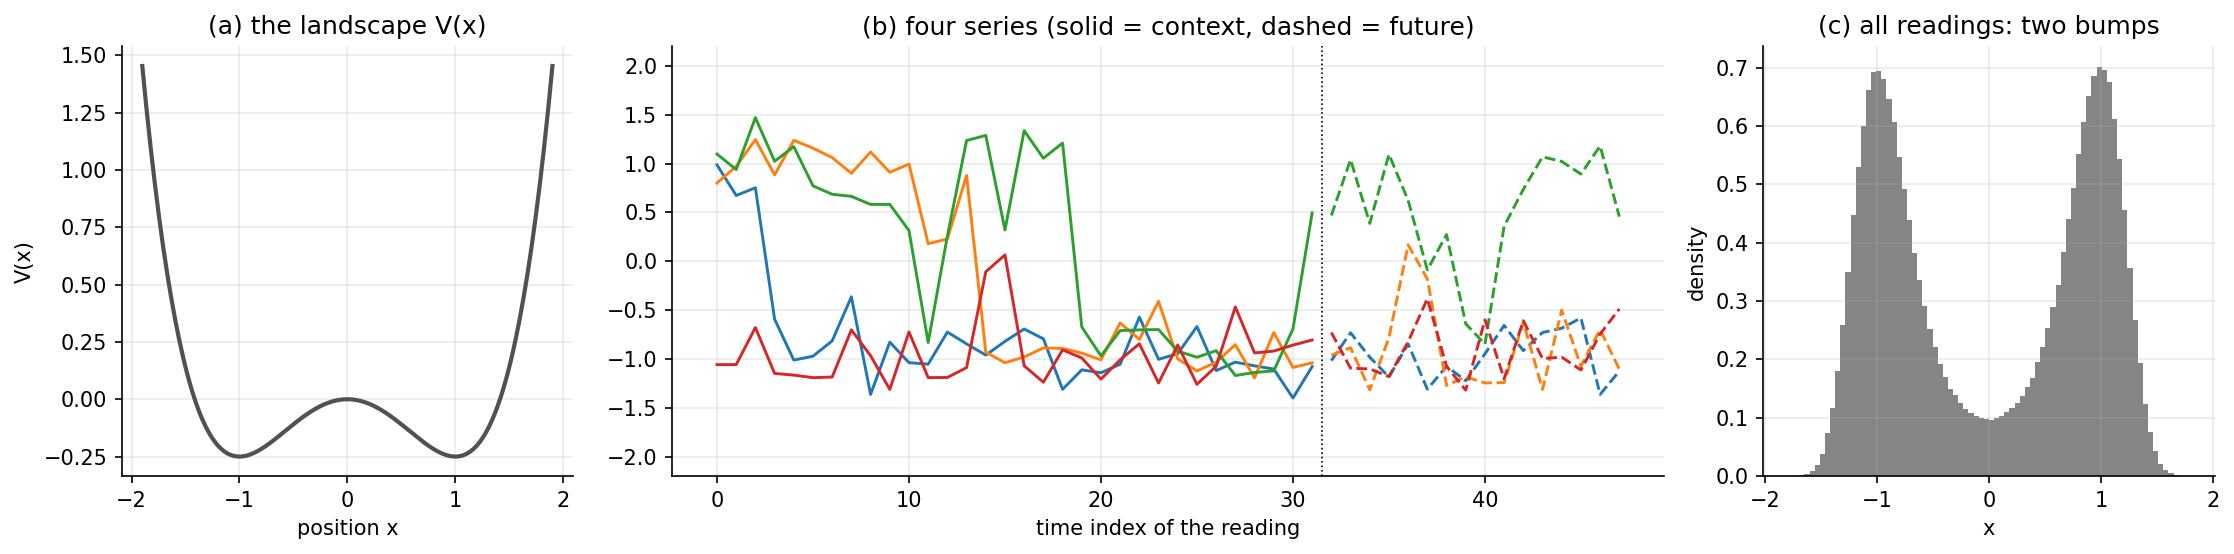
This dataset is a good test for two reasons. The future can really branch, because a ball that sits near the barrier can fall into either well. And we know the true answer, because the physics has no memory beyond the current position, so for any context we can restart the simulator from the last reading as often as we like. This is the “repeat the same situation a thousand times” (Section 1.1) made real, and it gives us samples of the true distribution of futures. As in the previous parts, the model sees a context of readings and has to forecast the next readings one step at a time.
9.2 Plugging the diffusion head into the forecaster
The step that connects everything back to the previous articles is a small one. The forecaster of Parts I and II had an encoder that reads the context and compresses it into a summary vector , and two heads that turn into a mean and a variance. We keep the encoder and replace the heads:
···
10. Results
We train two forecasters on the double well that are identical in every respect except for the head, so that any difference between them is a difference in the shape they are allowed to express. For each of the 1,000 test contexts we then roll out trajectories of steps from each model, and we do the same with the true simulator.
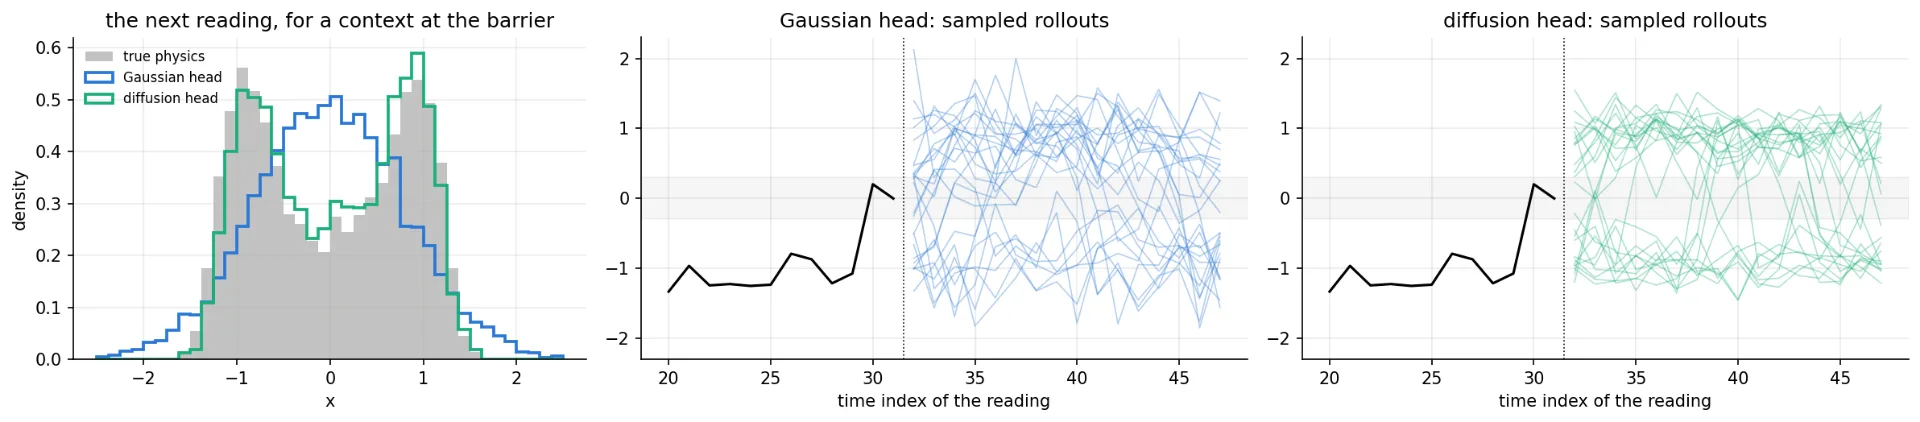
Forecasts for a context that ends at the barrier. Left: the true distribution of the next reading has two bumps with a dip between them; the Gaussian head gives one broad bump centred on the dip, and the diffusion head reproduces both bumps. Middle and right: 25 sampled rollouts from the Gaussian head and from the diffusion head, with the barrier region shaded.
Many of the Gaussian paths start in the barrier region, hesitate there for a few steps and only then drift to one side, whereas the diffusion paths leave the barrier quickly and commit to a well, as the real ball does.
To put numbers on this over all test contexts, I use the Continuous Ranked Probability Score (CRPS), which for forecast samples and and an observed value is:
The first term rewards samples that land close to what actually happened, and the second gives credit back for honest spread, so that a model is not punished for being uncertain when the future really is uncertain. Lower is better, and since part of the future is genuinely random, even the true physics does not score zero.
|
Near the barrier |
CRPS |
Share of forecasts on the barrier |
|---|---|---|
|
true physics |
|
|
|
Gaussian head |
|
|
|
diffusion head |
|
|
By the CRPS, the two heads are practically tied: against . Yet Figure 10 shows a difference that nobody could miss, and the second column puts a number on it, the barrier share, which is the fraction of forecast values that fall into the region , where the real ball spends less than of its time. The Gaussian head puts twice as many forecasts there, and the diffusion head matches the truth. A score designed to judge entire distributions simply does not see the difference in shape.
There is a lesson here that goes beyond diffusion models. A single summary number hides a difference in risk in Part I, and here a far more sophisticated summary number hides a difference in shape, so whenever you can, look at the samples.
···
11. Costs and limits
None of this is free, and it would not be in the spirit of this series to pretend otherwise. The costs:
-
Sampling time. One trajectory of sixteen steps costs small network calls instead of 16. On a CPU, the rollouts of all test contexts took about a second for the Gaussian head and about a minute and a half for the diffusion head. Faster samplers exist, but they are a topic of their own.
-
No formula. With two heads you can read off and and compute any probability in closed form. With a diffusion head, every interval or threshold probability has to be estimated from samples, which is fortunately what Part II taught us to do anyway.
-
Training time. Roughly five times longer for the diffusion head, well over a minute against less than twenty seconds.
-
A small bias from few steps. As Section 7 explained, with even a perfect network produces bumps that are about a fifth too narrow, which is the price I accepted for a notebook that runs in minutes.
And the limits of the experiment:
-
Easy data. The data is one-dimensional and synthetic, and the system has no memory beyond its last reading, which makes the job of the encoder easy and is the reason why we know the true answer. For the same reason the notebook uses a small multilayer perceptron as the encoder instead of the transformer of Parts I and II; the transformer can be swapped back in without touching the heads.
-
One run, no tuning. The results come from one random seed and from small networks without any tuning.
-
Comparisons I left out. I did not train a mixture density network, which would handle this particular problem well as long as somebody tells it that there are two bumps, and I did not forecast the whole horizon in one shot, since both would have distracted from the single comparison this article is about.
Where to read more
This article took one path through diffusion models, the one that leads to forecasting the next value of a signal. The introductions below take other paths, nearly all of them through images, and they complement this one well. I list them by what you might be looking for, with the sections of this article they correspond to.
If you want pictures and plain language first.
-
Introduction to Diffusion Models for Machine Learning by Ryan O’Connor (AssemblyAI) explains the forward and the reverse process with clear diagrams and contrasts diffusion with earlier generative models.
-
A Gentle Introduction to Diffusion by Brett Young (Weights & Biases) is a visual walk through noise schedules and noise prediction.
-
Diffusion Models: A Practical Guide (Scale AI) is about using image generators in practice, and is the place to go if your interest is in generating pictures and not in the mechanism.
If you want the full theory.
-
What are Diffusion Models? by Lilian Weng is the standard reference. It derives the lower bound of our Section 6 for vectors, in full generality, and goes on to topics I left out, such as faster samplers and guidance.
-
Understanding Diffusion Models: A Unified Perspective by Calvin Luo builds up to diffusion from variational autoencoders and shows that predicting the clean value, predicting the noise and predicting the “score” are three views of the same thing.
What none of them does, as far as I know, is what this article is about: denoising a single future value of a time series, given its past, inside an autoregressive rollout, and checking the result against a known truth.
···
References
-
J. Ho, A. Jain, P. Abbeel, Denoising Diffusion Probabilistic Models, NeurIPS 2020.
-
A. Nichol, P. Dhariwal, Improved Denoising Diffusion Probabilistic Models, ICML 2021 (the cosine schedule).
-
C. M. Bishop, Mixture Density Networks, Technical Report, Aston University, 1994.
-
D. P. Kingma, M. Welling, Auto-Encoding Variational Bayes, ICLR 2014 (continuous hidden variables and the ELBO).
-
K. Rasul, C. Seward, I. Schuster, R. Vollgraf, Autoregressive Denoising Diffusion Models for Multivariate Probabilistic Time Series Forecasting (TimeGrad), ICML 2021.
-
T. Li, Y. Tian, H. Li, M. Deng, K. He, Autoregressive Image Generation without Vector Quantization (MAR), NeurIPS 2024.
-
C. M. Bishop, H. Bishop, Deep Learning: Foundations and Concepts, Springer, 2024, Chapters 15, 16 and 20.
-
T. Gneiting, A. E. Raftery, Strictly Proper Scoring Rules, Prediction, and Estimation, Journal of the American Statistical Association, 2007 (CRPS).