We will look at the Online Sales for Germany and for the colours “Black”, “White” and “Green”:
Figure 1 – Result set from the base query (Figure by the Author)
We will work with these numbers from now on.
Next, I will create a measure to get the results for “Black” and “White” only:
DEFINE VAR SelYear = TREATAS({ 2025 }, 'Date'[Year]) VAR SelCountry = TREATAS({ "Germany" }, Geography[RegionCountryName]) VAR SelColors = TREATAS({ "Black", "White", "Green" }, 'Product'[ColorName]) MEASURE 'All Measures'[SalesBlackWhite] = CALCULATE([Sum Online Sales] ,'Product'[ColorName] IN {"Black", "White"} )EVALUATE SUMMARIZECOLUMNS(Geography[CityName] ,'Date'[Year] ,'Product'[ColorName] ,SelYear ,SelCountry ,SelColors ,"Online Sales", [Sum Online Sales] ,"Black and White Sales", [SalesBlackWhite] )
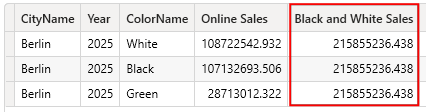
The result of the measure [SalesBlackWhite] is the following:
Figure 2 – These are the results of the measure [SalesBlackWhite]. As expected, the results are the same in every row, as the measure replaces the filter on each row. (Figure by the Author)
Now it’s important to remember how DAX works when setting a filter on a column:
It replaces any existing filter on the column.
This means that the filter “forgets” that each row has a different colour and calculates the sum of both “Black” and “White”.
One way of keeping the distinct values is to use KEEPFILTERS():
DEFINE VAR SelYear = TREATAS({ 2025 }, 'Date'[Year]) VAR SelCountry = TREATAS({ "Germany" }, Geography[RegionCountryName]) VAR SelColors = TREATAS({ "Black", "White", "Green" }, 'Product'[ColorName]) MEASURE 'All Measures'[SalesBlackWhite] = CALCULATE([Sum Online Sales] ,KEEPFILTERS('Product'[ColorName] IN {"Black", "White"} ) )EVALUATE SUMMARIZECOLUMNS(Geography[CityName] ,'Date'[Year] ,'Product'[ColorName] ,SelYear ,SelCountry ,SelColors ,"Online Sales", [Sum Online Sales] ,"Black and White Sales", [SalesBlackWhite] )
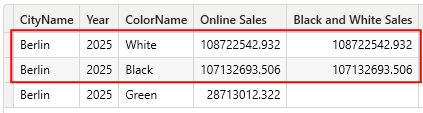
These are the results:
Figure 3 – The results of the measure after adding KEEPFILTERS() to get the distinct values instead of the sum of both colours (Figure by the Author)
The issue when nesting Measures
Now, what happens when we create an additional measure, reuse the existing measure [SalesBlackWhite], and add another colour, “Green,” to the filter?
DEFINE VAR SelYear = TREATAS({ 2025 }, 'Date'[Year]) VAR SelCountry = TREATAS({ "Germany" }, Geography[RegionCountryName]) VAR SelColors = TREATAS({ "Black", "White", "Green" }, 'Product'[ColorName]) MEASURE 'All Measures'[SalesBlackWhite] = CALCULATE([Sum Online Sales] ,'Product'[ColorName] IN {"Black", "White"} ) MEASURE 'All Measures'[SalesBlackWhiteGreen] = CALCULATE([SalesBlackWhite] ,'Product'[ColorName] IN {"Green"} )EVALUATE SUMMARIZECOLUMNS(Geography[CityName] ,'Date'[Year] ,'Product'[ColorName] ,SelYear ,SelCountry ,SelColors ,"Online Sales", [Sum Online Sales] ,"Black and White Sales", [SalesBlackWhite] ,"Black, White and Green Sales", [SalesBlackWhiteGreen] )
Now, I added a new measure [SalesBlackWhiteGreen]. This measure reuses [SalesBlackWhite] but adds a filter for “Green”.
This is the result:
Figure 4 – Results for the new [SalesBlackWhiteGreen] measure. As you can see, the new measure returns the same result. (Figure by the Author)
The new measure result is identical to the nested measure [SalesBlackWhite].
Why?
Based on the explanation above, the nested measure replaced the calling measure’s filter with Black and White.
This approach didn’t work out as expected.
Possible solutions
What can we do to get the needed result:
The Sales for “Black”, “White” and “Green” products?
You can try using KEEPFILTERS() to retain an existing filter:
DEFINE VAR SelYear = TREATAS({ 2025 }, 'Date'[Year]) VAR SelCountry = TREATAS({ "Germany" }, Geography[RegionCountryName]) VAR SelColors = TREATAS({ "Black", "White", "Green" }, 'Product'[ColorName]) MEASURE 'All Measures'[SalesBlackWhite] = CALCULATE([Sum Online Sales] ,KEEPFILTERS('Product'[ColorName] IN {"Black", "White"}) ) MEASURE 'All Measures'[SalesBlackWhiteGreen] = CALCULATE([SalesBlackWhite] ,KEEPFILTERS('Product'[ColorName] IN {"Green"}) )EVALUATE SUMMARIZECOLUMNS(Geography[CityName] ,'Date'[Year] ,'Product'[ColorName] ,SelYear ,SelCountry ,SelColors ,"Online Sales", [Sum Online Sales] ,"Black and White Sales", [SalesBlackWhite] ,"Black, White and Green Sales", [SalesBlackWhiteGreen] )
Again, the result is not as expected:
Figure 5 – Results when using KEEPFILTER() in the Measures (Figure by the Author)
This result is because of a filter conflict:
The outer measure filters the colour by “Green”
The nested measure keeps this filter and adds “Black” and “White”
These colliding filters cause an empty result.
Adding FILTER() instead of KEEPFILTERS() doesn’t change anything, as both produce the same result in this scenario.
You can find related content to these two functions in the References section below.
There are two ways of solving this issue.
First, you write two measures that apply the filters independently, without nesting the other measure:
DEFINE VAR SelYear = TREATAS({ 2025 }, 'Date'[Year]) VAR SelCountry = TREATAS({ "Germany" }, Geography[RegionCountryName]) VAR SelColors = TREATAS({ "Black", "White", "Green" }, 'Product'[ColorName]) MEASURE 'All Measures'[SalesBlackWhite] = CALCULATE([Sum Online Sales] ,'Product'[ColorName] IN {"Black", "White"} ) MEASURE 'All Measures'[SalesBlackWhiteGreen] = CALCULATE([Sum Online Sales] ,'Product'[ColorName] IN {"Black", "White", "Green"} )EVALUATE SUMMARIZECOLUMNS(Geography[CityName] ,'Date'[Year] ,'Product'[ColorName] ,SelYear ,SelCountry ,SelColors ,"Online Sales", [Sum Online Sales] ,"Black and White Sales", [SalesBlackWhite] ,"Black, White and Green Sales", [SalesBlackWhiteGreen] )
This time, the results are as expected:
Figure 6 – Results with the two separate measures (Figure by the Author)
The other way is to write a UDF to calculate the needed results.
In the following case, I’ve added a parameter to switch between the two needed filters:
fn_CalculateByColorFilter = (FormulaExpr : EXPR ,SwitchValue : NUMERIC VAL = 1) => IF ( SwitchValue = 1 ,CALCULATE(FormulaExpr ,'Product'[ColorName] IN { "Black", "White" } ) ,CALCULATE(FormulaExpr ,'Product'[ColorName] IN { "Black", "White", "Green" } ) )
Then, I can change the two measures to call the UDF:
SET DC_KIND="AUTO";WITH $Expr0 := ( ( PFCAST ( 'Online Sales'[UnitPrice] AS INT ) PFCAST ( 'Online Sales'[SalesQuantity] AS INT ) ) - PFCAST ( 'Online Sales'[DiscountAmount] AS INT ) ) , $Expr1 := ( ( PFCAST ( 'Online Sales'[UnitPrice] AS INT ) PFCAST ( 'Online Sales'[SalesQuantity] AS INT ) ) - PFCAST ( 'Online Sales'[DiscountAmount] AS INT ) ) , $Expr2 := ( ( PFCAST ( 'Online Sales'[UnitPrice] AS INT ) * PFCAST ( 'Online Sales'[SalesQuantity] AS INT ) ) - PFCAST ( 'Online Sales'[DiscountAmount] AS INT ) ) SELECT 'Product'[ColorName], 'Geography'[CityName], SUM ( @$Expr0 ), SUM ( @$Expr1 ), SUM ( @$Expr2 )FROM 'Online Sales' LEFT OUTER JOIN 'Date' ON 'Online Sales'[OrderDate]='Date'[DateKey] LEFT OUTER JOIN 'Product' ON 'Online Sales'[ProductKey]='Product'[ProductKey] LEFT OUTER JOIN 'Store' ON 'Online Sales'[StoreKey]='Store'[StoreKey] LEFT OUTER JOIN 'Geography' ON 'Store'[GeographyKey]='Geography'[GeographyKey]WHERE 'Date'[Year] = 2025 VAND 'Product'[ColorName] IN ( 'White', 'Black', 'Green' ) VAND 'Geography'[RegionCountryName] = 'Germany';
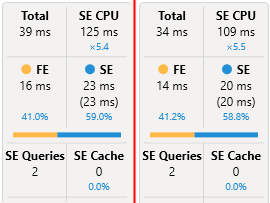
As you can see, the engine retrieves a list for all three colours and compiles the result in the Formula engine.
You can find more details on analysing DAX performance in the piece linked in the References section.
Conclusion
Understanding how filters are applied in DAX with the CALCULATE function is key to using nested measures.
If you don’t get the expected result, remember how filters are applied; nested measures can overwrite the filter set by the calling measure.
Try it with your data and different scenarios to see the effects.
For example, it can be very confusing when your data model has a chain of tables with relationships between them.
Then you must understand how filters move from one table to another to understand how the results are calculated.
Now you can explain the results and change your code to get the expected results.
References
To learn more about KEEPFILTERS() and FILTER(), read these two pieces:
Uncovering the secrets of KEEPFILTERS in DAXThe KEEPFILTERS() function in DAX is an underestimated function. Let’s go into the rabbit hole of this function and discover some secretsSalvatore Cagliari · 8 min readHow to use FILTER in DAX the correct wayThe FILTER() function in DAX can be challenging to tame. Here are some examples on how to use it and how not.Salvatore Cagliari · 11 min readHow to Get Performance Data from Power BI with DAX StudioSometimes we have a slow Report, and we need to figure out why. I will show you how to collect performance data and what these metrics mean.Salvatore Cagliari · 9 min read
Like in my previous articles, I use the Contoso sample dataset. You can download the ContosoRetailDW Dataset for free from Microsoft here.
The Contoso Data can be used freely under the MIT License, as described in this document.
I updated the dataset to shift the data to contemporary dates and removed all tables not needed for this example.





 Uncovering the secrets of KEEPFILTERS in DAXThe KEEPFILTERS() function in DAX is an underestimated function. Let’s go into the rabbit hole of this function and discover some secretsSalvatore Cagliari · 8 min read
 How to use FILTER in DAX the correct wayThe FILTER() function in DAX can be challenging to tame. Here are some examples on how to use it and how not.Salvatore Cagliari · 11 min read
 How to Get Performance Data from Power BI with DAX StudioSometimes we have a slow Report, and we need to figure out why. I will show you how to collect performance data and what these metrics mean.Salvatore Cagliari · 9 min read